The four assumptions are:
Linearity of residuals
Independence of residuals
Normal distribution of residuals
Equal variance of residuals
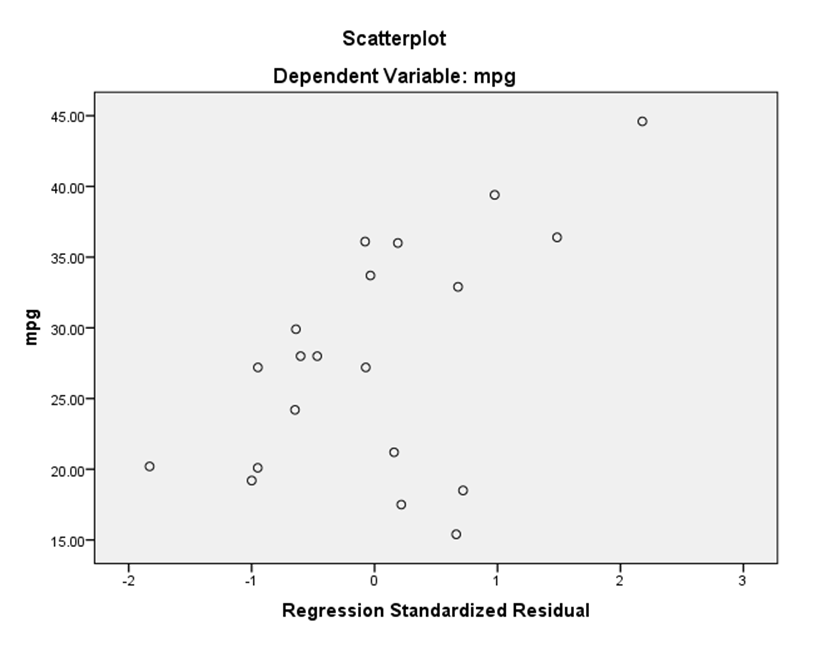
Linearity – we draw a scatter plot of residuals and y values. Y values are taken on the vertical y axis, and standardized residuals (SPSS calls them ZRESID) are then plotted on the horizontal x axis. If the scatter plot follows a linear pattern (i.e. not a curvilinear pattern) that shows that linearity assumption is met.
Independence – we worry about this when we have longitudinal dataset. Longitudinal dataset is one where we collect observations from the same entity over time, for instance stock price data – here we collect price info on the same stock i.e. same entity over time.
We generally have two types of data: cross sectional and longitudinal. Cross -sectional datasets are those where we collect data on entities only once. For example we collect IQ and GPA information from the students at any one given time (think: camera snap shot)
Longitudinal data set is one where we collect GPA information from the same student over time (think: video).
In cross sectional datasets we do not need to worry about Independence assumption. It is “assumed” to be met.
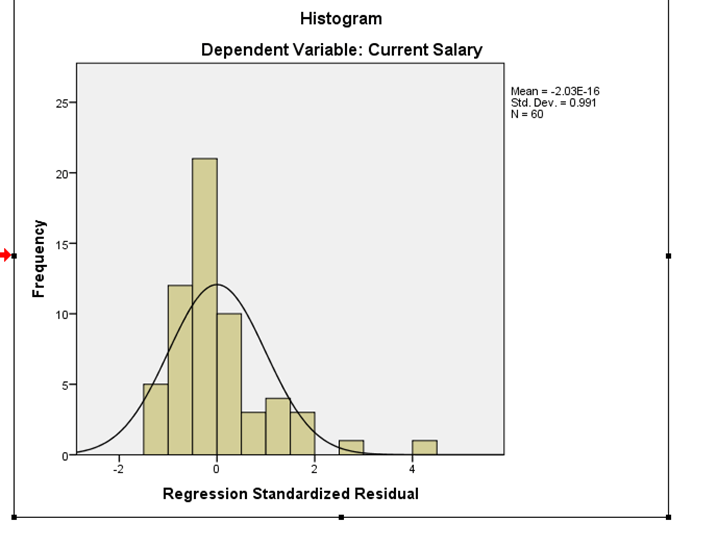
Normality: we draw a histogram of the residuals, and then examine the normality of the residuals. If the residuals are not skewed, that means that the assumption is satisfied.
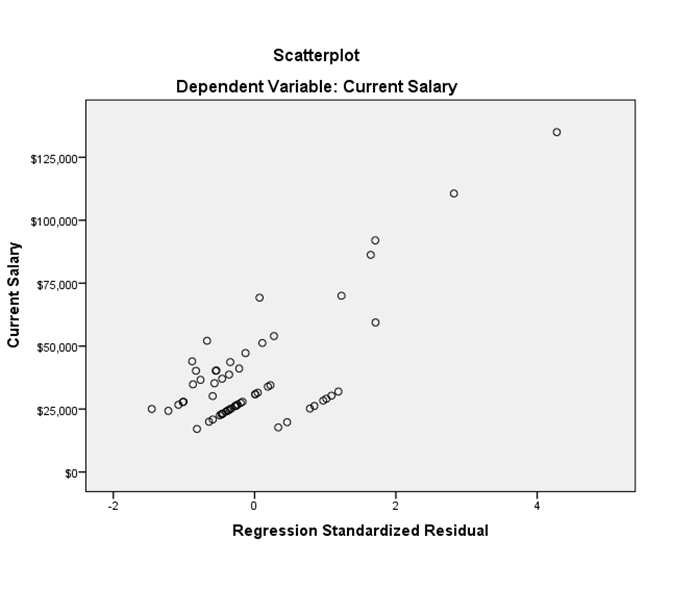
Equality of variance: We look at the scatter plot which we drew for linearity (see above) – i.e. y on the vertical axis, and the ZRESID (standardized residuals) on the x axis. If the residuals do not fan out in a triangular fashion that means that the equal variance assumption is met.
In the above picture both linearity and equal variance assumptions are met. It is linear because we do not see any curve in there. It also meets equal variance assumption because we do not see the residuals “dots” fanning out in any triangular fashion.
In the picture above both linearity and equal variance assumptions are violated. There is a curve in there that’s why linearity is not met, and secondly the residuals fan out in a triangular fashion showing that equal variance is not met as well.
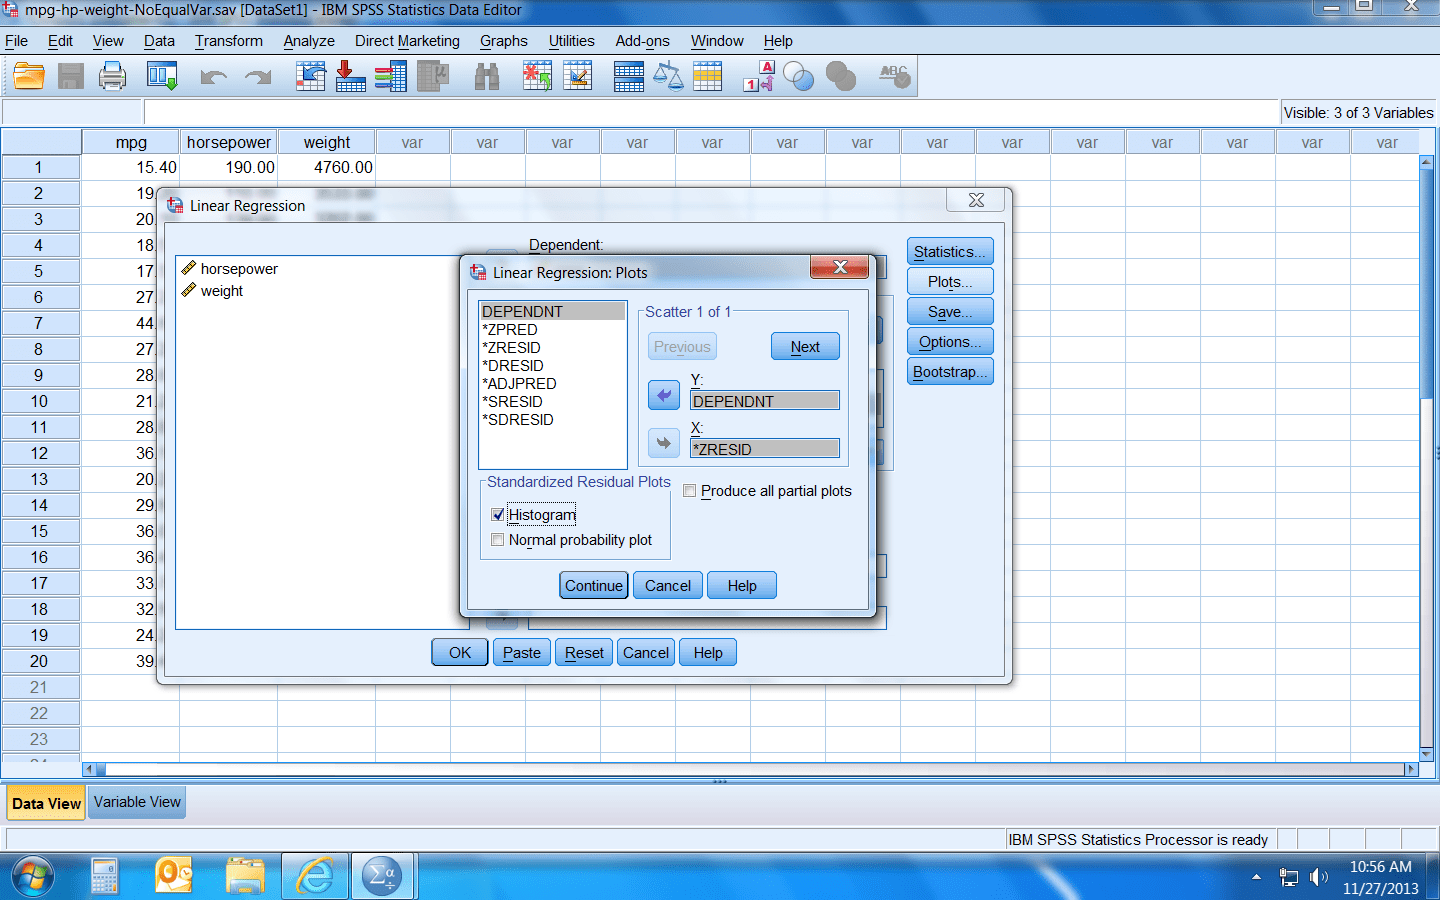
Using SPSS to examine Regression assumptions:
Click on analyze >> Regression >> Linear Regression
Then click on Plot and then select Histogram, and select DEPENDENT in the y axis and select ZRESID in the x axis.