CATL Workshop: Create Interactive Video with PlayPosit

Computer Screen Icon

Do you ever feel like students aren’t watching your class videos? Or, even if they are watching, the information is going in one ear and out the other? CATL has a solution for that! Using PlayPosit to make your videos interactive increases engagement and retention. PlayPosit integrates with Canvas and your Kaltura My Media library, allowing you to quickly add predictive exercises, comprehension checks, reflective prompts, and more to class videos.

Join our one-hour virtual workshop at 8:15am on Thursday, October 17 to experience what it’s like to interact with PlayPosit and to build your first interactive video. Attendees are encouraged to have a Kaltura or public YouTube video in mind that they want to add interactive elements to when joining the session. Register below to receive a Zoom link and calendar invite.

Nintendo Switch Graphic titled you have a ticket to ride

Ride the Active Learning Train: A Wacky Wednesday Follow-Up

At CATL’s most recent Wacky Wednesday event on September 25, we embarked on a cross-continental ride aboard the active learning train with the engaging board game “Ticket to Ride.” This hands-on session gave us a chance to “lay the tracks” for active learning strategies that can improve student retention and success in any discipline.

Active learning shifts the focus from passively receiving information to actively engaging with the materials. Research shows that engaging your students in this way improves retention, critical thinking, and success across various disciplines. Plus, active learning doesn’t have to be complicated or time-consuming for instructors to implement. If you’d like to get a 1-on-1 demonstration of active learning, reach out to CATL and we will be happy to meet with you.

Our Wacky Wednesday events are a fun, casual way to see these methods in action. If you missed the ride, don’t worry – there will be plenty more stops on the active learning line! We hope to see you onboard for future sessions, where we’ll continue to experiment and have fun with innovative teaching techniques.

Mark your Calendars!

Make sure to save the date for our next Wacky Wednesday on Nov. 20, 2024. More details to come.

Wacky Wednesday: Escape Room Challenge (May 8, 3:00 – 4:30 p.m.)

The Center for the Advancement of Teaching and Learning (CATL) welcomes faculty and staff to join us for our last Wacky Wednesday of the semester: Escape Room Challenge on May 8 from 3:00 – 4:30 p.m. This isn’t just any Wacky Wednesday – it is a call to action! Our CATL Team is “locked” in the conference room, and only your wits can help free us!


Join us for a unique, hands-on experience that will not only test your problem-solving skills but also provide you with the knowledge and inspiration to bring the world of escape rooms into your own classroom. In addition to participating in this activity, you’ll hear from instructors who have created both virtual and physical escape rooms by incorporating their own course content and you’ll walk away with a list of resources to help you get started creating your own escape room activity.

Escape rooms can be used to create engaging learning experiences both inside and outside the classroom, so all faculty and staff are welcome to attend. Whether you are looking to fully immerse yourself in the escape room or just pop in to see what the buzz is about, there’s no need to register – just show up ready for fun and learning at the CATL conference room (CL 405C) or join us virtually. If you would like an Outlook Calendar invitation to this event, send us an email!

If you have questions or need accommodations for this event, email CATL (CATL@uwgb.edu).

Making Impactful Use of Canvas Analytics in Your Course

Like many websites, Canvas collects data from users as they navigate their courses. Thankfully, unlike many websites, Canvas collects this data not for the purpose of selling it to advertisers but for the purpose of presenting it to instructors. Canvas presents collected student activity data in a course page titled “New Analytics,” which contains charts and tables designed to help instructors make use of this data. While New Analytics contains well-organized representations of course data, it does not prescribe specific actions or provide a formula for making use of the data. In this post, we summarize the data available in New Analytics and recommend ways you can interpret it to take actions in your course that can help improve student outcomes. 

Detecting Course Trends 

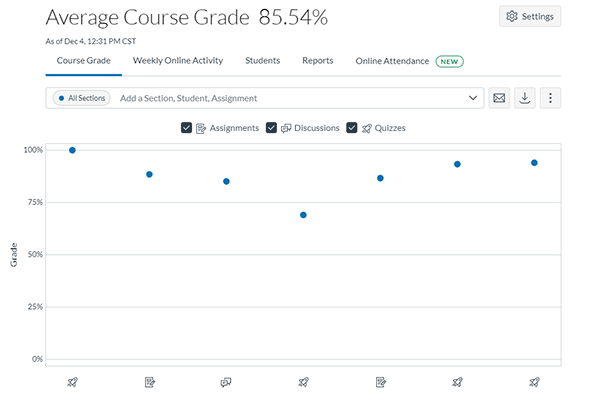
New Analytics Window

New Analytics can help reveal trends in student achievement from assignment to assignment and student engagement from week to week. After launching New Analytics from the course navigation menu or the button on the right side of the course Home page, you’ll see a series of tabs across the top of the page. The first two tabs, “Course Grade” and “Weekly Online Activity” have data views that can help you identify course trends. The Course Grade tab has a chart which shows the average grade for each assignment in your course. Each assignment in your course will be represented by a dot on this chart. The dot’s position on the y-axis represents the average grade for that assignment. A quick glance at this chart can help you identify the assignments where the class atypically excelled or struggled and help you confirm—or refute—suspicions you developed about performance trends while grading assignments. Thinking critically about why the class might have been more or less successful on a particular assignment can lead to ideas for course design improvements. A close look at a successful assignment may lead to insights on what works well in a course; a close look at a less successful assignment may reveal a need to incorporate scaffolding assignments and additional support. Clicking on an assignment’s dot on the chart will reveal additional statistics, including a grade distribution chart and the number of missing and late submissions. 

Clicking the Weekly Online Activity tab will show a chart of the average page views and course participation actions during each week of the course. Viewing this chart can help you identify whether engagement with your Canvas course is waning, holding steady, or growing. Beneath the chart is a table of course resources which shows how many students have viewed each item, how many overall views it’s received, and how many times a student has participated (a list of the actions Canvas counts as a “participation” can be found in this Canvas guide). You can sort this table by any of its columns to identify which elements of your course get the most and least engagement. If an important resource in your course isn’t garnering as many views as you’d like it to, ask yourself “why?” and consider ways to either guide your students to that resource or phase it out and incorporate its key content into the resources your students are reliably viewing (Clum, 2021). Look at the resources that have gotten the most views and participation and check for commonalities to gain insight on what captures your students’ attention. You can click on any data point in the Weekly Online Activity chart to open a panel that shows activity data filtered for that specific week. The data in this panel can give you an idea of whether students are keeping up with the pace of your course or whether they are still working through older resources. 

Checking on Individual Students 

New Analytics can also help you identify students who may benefit from an intervention from a professional adviser because they have disengaged with your course or never engaged at all. The Students tab of the New Analytics page shows a table with the following statistics for each student: 

  • Current grade 
  • Percentage of assignment submissions made on time 
  • Last date of a participation action 
  • Last date the student viewed any page in your course 
  • Count of total page views 
  • Count of total participation actions 

You can click any column header on this table to sort the table by that column. Looking at this table during the first few weeks of a term and sorting it by “Page Views” can help you quickly identify students who have not engaged with the Canvas course. Students with no or very low page view counts have not engaged with your course. You can issue an ad-hoc alert in EAB Navigate to request that UW-Green Bay’s professional advising team reach out and help set a student on a path to academic success. 

Clicking on a student’s name in this table will open a student-specific data view that shows that particular student’s assignment grades and weekly activity over time. If you’ve noticed a downturn in a student’s performance or engagement, this view can help back up your observations with data. Comparing a student’s assignment grades or activity with the class average can help you contextualize any trends you see. You can view an individual student’s data alongside the class average on the same chart by adding that student to the filter field above the chart on the Course Grade or Weekly Online Activity tabs.

Sending Smart Messages 

Sending Smart Messages in Canvas

New Analytics also makes it easy to send messages to students who fit certain performance or activity criteria. As you explore the Analytics tool in your course, keep an eye out for the message icon that can be found on most of the tabs and panels. Clicking this icon will begin composing a Canvas Inbox message which you can send to students that meet a customizable criterion related to an assignment grade, weekly activity, or engagement with a specific resource. Here are a few examples of the types of messages you can target through New Analytics: 

  • Check-in with students who haven’t yet viewed the course this week 
  • Send congratulations to the students who did well on an assignment 
  • Encourage a growth mindset for students who struggled with an assignment and point them to helpful resources 
  • Remind students who have missing assignments to make a submission 

These quick instructor encouragements and interventions can help your students stay engaged with the course and on-target to reach their goals (Bostwick & Becker-Blease, 2018). Especially in online asynchronous courses, sending these targeted check-in messages can help establish your presence and ensure that students know you care about their success. 

Try It Out!

Coupling the data in Canvas New Analytics with the observations you make while teaching can help you make accurate judgments about what works well and not so well in your course. It can also help you identify when a student needs some additional support, and the incorporated messaging tool makes it easy to follow-up. We encourage you to open the New Analytics page in your Canvas courses, explore the data within, and ask yourself whether what you see aligns with your assumptions of how students experience your course. Try sending a congratulatory message to the students that excelled on an assignment and a friendly reminder message to the students who owe you work. We’d love to hear about your experience exploring and interpreting the data! Please feel free to reach out to us at CATL@uwgb.edu to tell us your story, ask a question, or request a consultation!

References 

  • Bostwick, K. C. P., & Becker-Blease, K. A. (2018). Quick, Easy Mindset Intervention Can Boost Academic Achievement in Large Introductory Psychology Classes. Psychology Learning & Teaching, 17(2), 177–193. https://doi.org/10.1177/1475725718766426 
  • Clum, K. (2021, May 14). Using canvas analytics to support student success. KatieClum.org. Retrieved December 5, 2022, from https://katieclum.org/2021/05/14/using-canvas-analytics-to-support-student-success/ 

Evidence-Based Frameworks and Strategies for Keeping Students Engaged

Keeping students engaged in their learning throughout an entire semester is a challenge that exists across all disciplines and modalities. Though the ways in which you implement strategies for increasing student engagement might vary because of these factors, the good news is that the underlying principles remain the same. Below are some of the key methods and strategies that have emerged as common themes across many studies on the relationships between teaching practices and student engagement.

Foster a Culture of Growth, Trust, and Belonging

Part of a student’s engagement in a course is tied to the affective domain of learning, or a student’s thoughts and feelings about their own learning. Does the student feel like they belong in this learning environment? Are they respected by their peers and the instructor? Do they see their instructor as an ally in the learning journey, or as an adversary?

One aspect of the affective domain is whether an individual has a growth mindset or a fixed mindset. The Center for Learning Experimentation, Application and Research at the University of North Texas has a great list of growth mindset interventions instructors can implement. It is worth noting, however, that research seems to indicate the effectiveness of these interventions is contingent on the instructor’s mindset as well. Studies have shown that instructors with a greater growth mindset (as opposed to a fixed mindset) have smaller racial achievement gaps and inspire more student motivation in their courses.

The affective domain also includes students’ feelings of belonging and trust. While the degree to which you can affect these feelings has limitations, evidence-based practices usually boil down to how you interact with students and facilitate interactions between students. A few examples include using a welcoming tone in your syllabus, modelling inclusive language, and taking the time to get to know your students’ names. Even in asynchronous classes it is important to build trust with your students. For example, you might want to consider using a week-one survey to provide your students with an opportunity to tell you about themselves.

Break Up Lectures & Add Opportunities for Active Learning

When there is a lot of content that needs to be disseminated across the duration of the semester, lectures are a common method for communicating that information quickly and efficiently. But the longer and denser the lecture is, the more instructors risk losing their students along the way due to cognitive load.

One solution is to build pause points into your lectures. Students benefit from structured pauses during lectures as it allows them space to question, process, and reflect on the information that they’ve absorbed. For pre-recorded lectures, the same idea can be achieved by breaking up a long lecture video into multiple short, topical videos (research suggests 6-12 minutes is an ideal length for maintaining student engagement). Fortunately, Kaltura (My Media) makes it very easy to trim and save video clips from right within Canvas.

When adding pauses for students to digest information, it is also beneficial to create opportunities for active learning activities. These activities can be very brief, such as using an anonymous polling tool to check for student understanding during a lecture. For more in-depth active learning, consider making time for small group discussions, written reflections, and other exercises that require students to employ higher order thinking skills. For courses with an asynchronous component, PlayPosit allows instructors to add a variety of engagement activities to pre-recorded lecture videos, while Hypothesis may be useful for incorporating annotation and reflection activities into assigned readings.

Provide Transparency and Support

When a student needs to spend a lot of mental energy figuring out the logistics of how to complete an activity, they have less mental energy left to engage with the course materials themselves. Therefore, transparency and scaffolding are both key elements to designing engaging assignments.

The Transparency in Learning and Teaching (TiLT) framework is designed to help instructors write clear and descriptive instructions for learning materials and assignments. For this framework, lay out the task, purpose, and criteria for each learning activity. If a student knows what they are supposed to do, why they are supposed to do it (how it ties to the course learning outcomes), and how they are going to be assessed, they can go into the activity more confident in their ability to engage with it.

It is common for a student to stop engaging with a course if they feel like they don’t have the means or resources to complete the tasks they’ve been assigned. Proper instructional scaffolding can help counter this issue by bridging some of the cognitive gaps and reducing the number of students that fall through the cracks. For example, if the final assignment in your course is an 8-page research paper, consider breaking up the process into several smaller assignments, such as having students submit their topic, bibliography, and outline at various points throughout the semester. Other ways to provide scaffolding this assignment might include modelling (providing examples of papers that meet the outcomes of the assignment), incorporating instructor or peer feedback for the outline or an early draft of the paper, and providing a robust rubric to guide students on how to meet the assignment outcomes.

Additional Resources

Engaging students is a broad topic that we are only just able to scratch the surface of in this post. Below are some resources for further reading if you’d like to dive in deeper.

Questions?

As always, we welcome you to share your ideas for engaging students by dropping a comment below or emailing us at CATL@uwgb.edu. If you’d like to discuss any of these methods or ideas one-on-one, a CATL member would be happy to meet with you for a consultation as well.