Importable Canvas Resources on Canvas Commons

CATL has created several Canvas resources that UWGB instructors can import directly into their Canvas courses through the Canvas Commons. To import any of the following resources in your course, access Commons from the global navigation menu while signed into Canvas, and search for the resource by its title below. You can import the resource directly into your course(s) right from Commons. For full instructions, please see the KnowledgeBase guide Canvas (Instructors) – Importing a Resource from Canvas Commons.

  • UWGB Student Resource Module – This importable module provides information to students on how to use Canvas and how to get help from student support services at UW-Green Bay.
  • UWGB Name Pronunciation Recording Assignment – This importable assignment guides students through the process of making a very brief audio or video recording of themselves pronouncing their own name, saving that recording to their Kaltura My Media library, and then adding a share link to that recording to their Canvas user profile’s “Links” section. Students and instructors can then access each other’s profiles through the People page or discussions to listen to each other’s name recordings and learn how to pronounce each other’s names.
  • Kognito Training Assignments – Assign a Kognito training simulation to students as part of your course to prepare them to engage with issues of mental health, inclusion, and wellness. Find out more about Kognito and each available training on the UWGB Wellness Center’s website.
    • UWGB Kognito “At-Risk Mental Health for Students”
    • UWGB Kognito “Cultivating Inclusive Communities”
    • UWGB Kognito “Sexual Misconduct Prevention”
    • UWGB Kognito “Alcohol and Other Drugs”

10 Dos and Don’ts of Digital Accessibility

Accessibility involves designing materials so that as many people as possible can engage with them, regardless of users’ physical or cognitive abilities. Meeting baseline accessibility standards is key to inclusive course design, and the digital age has made it faster and easier than ever to create accessible materials. Small changes to a document, like using a clear font and appropriately-sized text, can significantly improve the user experience. To get you started, we have assembled a list of some critical “dos and don’ts” of digital accessibility, along with guides from Microsoft Word, Microsoft PowerPoint, and Canvas for each category.

Contents

Text Styles

Screenshot of black text displayed on a white background that reads, ‘Your video submission must be in MP4 format.’ The words ‘MP4 format’ are emphasized in red text font and yellow highlight.

Don’t… ❌

Use underlining, highlighting, or text color alone to denote emphasis or create meaning.

Screenshot of black text on a white background that reads, Important: Your video submission must be in MP4 format. The words Important and MP4 format are emphasized in bold.

Do… ✅

Use bold or italic styling sparingly to emphasize words or short phrases within the body of a text. To call attention to an entire sentence or section, consider writing “Important” before the content.

Use underlining only for hyperlinks to assist people who are color blind in differentiating them from regular text. Similarly, avoid using text color and highlighting alone for emphasis as they may be challenging to distinguish. Some screen readers do not announce bold or italicized text, so refrain from using text styles alone to create meaning.

Headings & Document Structure

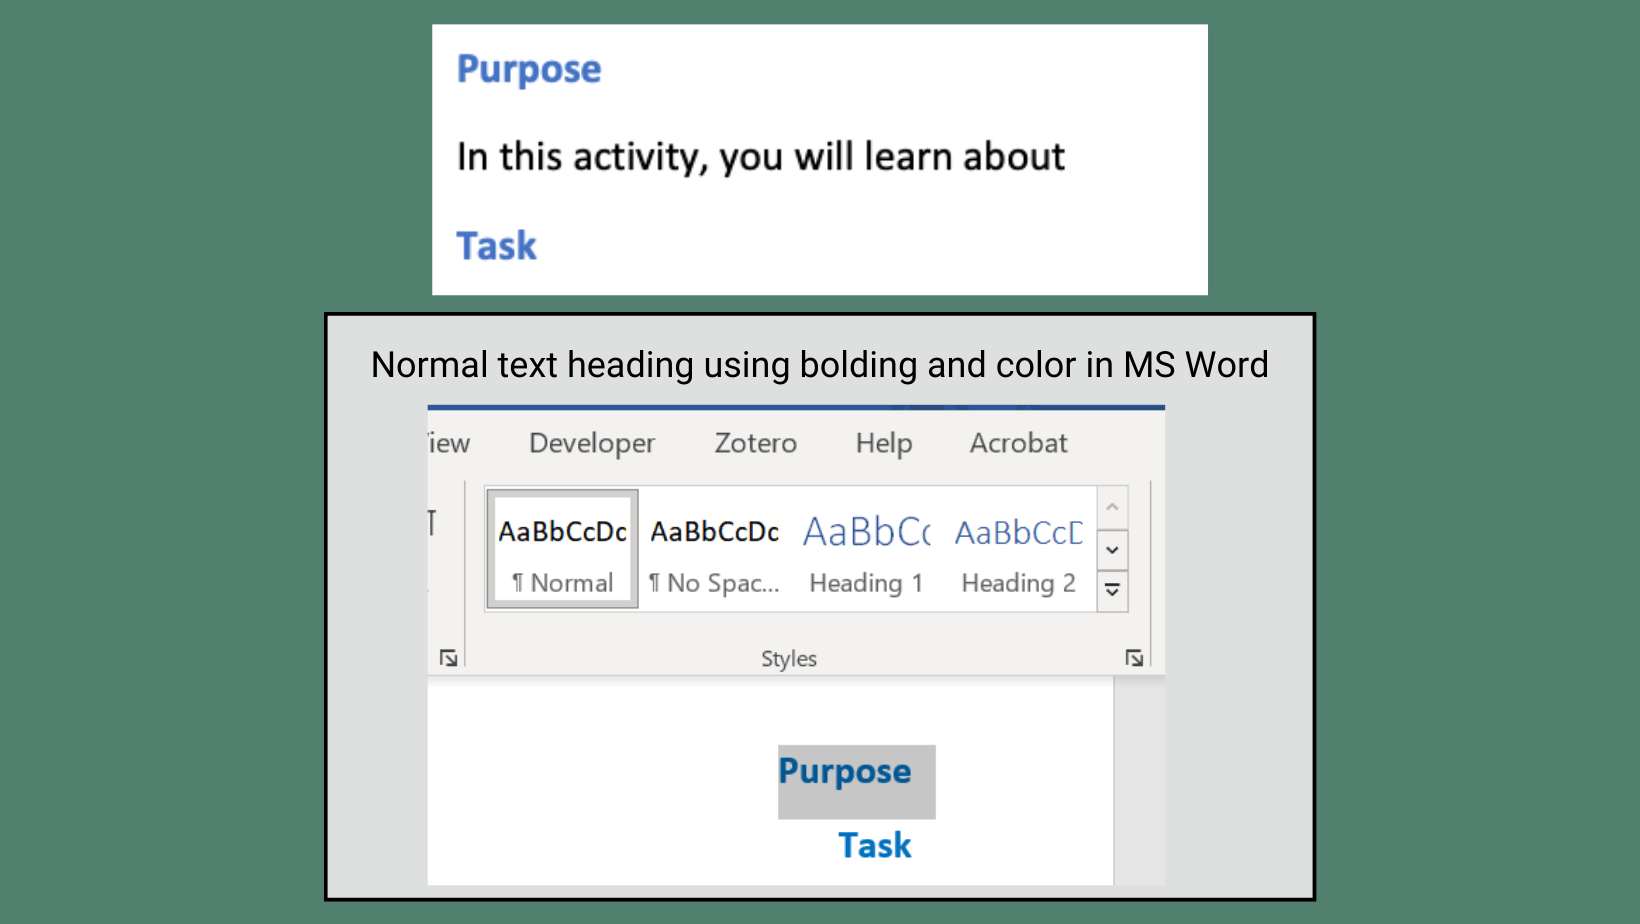
Image containing two screenshots. The first screenshot shows a document with the word ‘Purpose’ emphasized in blue and bolded text. Below ‘Purpose’ is plain black text that reads, ‘In this activity, you will learn about.’ The document ends with the word ‘Task’ also emphasized in blue and bolded text. The second screenshot displays the text style pane in Microsoft Word. It indicates that the text in the screenshot is formatted with the ‘Normal’ text style.

Don’t… ❌

Create headings by manually adjusting text sizes, styles, or colors.

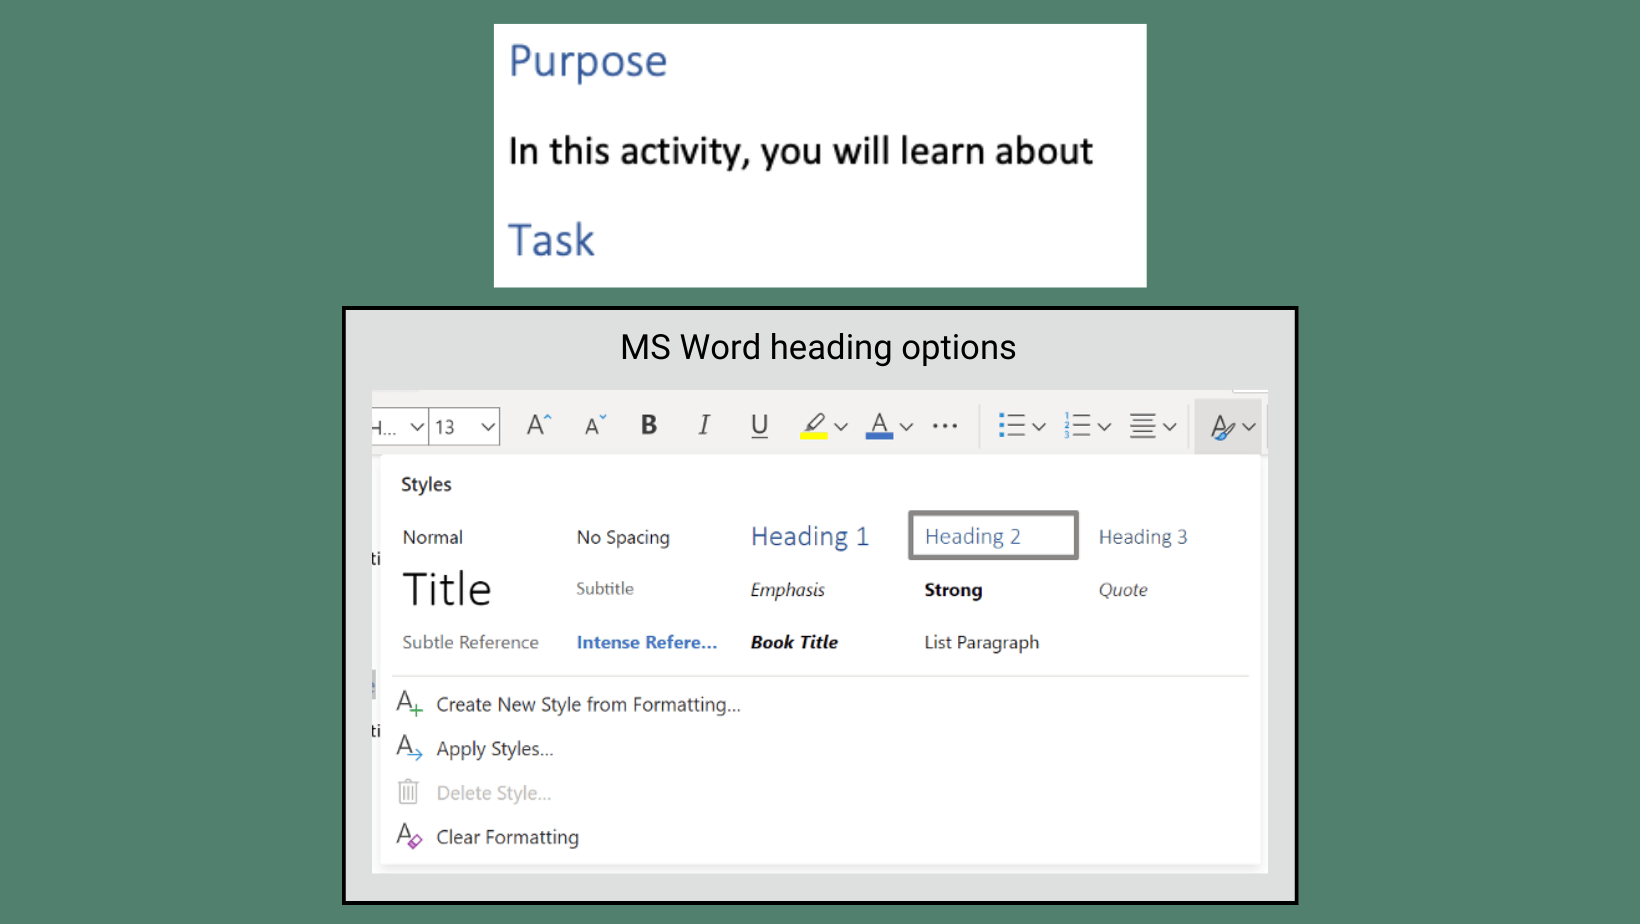
Image containing two screenshots from Microsoft Word. The first screenshot shows a document with the word ‘Purpose’ using the built-in Heading 2 style option. Below ‘Purpose’ is plain black text that reads, ‘In this activity, you will learn about.’ The document ends with the word ‘Task’ also using the Heading 2 style option. The second screenshot, positioned below the first, displays the Heading style panel in Microsoft Word.

Do… ✅

Use built-in heading styles in Word and the Canvas Rich Content Editor to organize content hierarchy. In PowerPoint, make sure to use an accessible template, add a title to every slide, and double-check slide reading order.

The built-in heading styles in these applications add special HTML code that makes it easier for people who use assistive tools to navigate a document.

Screenshot of a hyperlink formatted as a raw web URL, shown in blue underlined text. Below the URL, there is another hyperlink formatted in blue underlined text that reads ‘Click Here’.

Don’t… ❌

Use messy URLs or hyperlinks that do not make sense without context.

Screenshot of a hyperlink formatted in blue underlined text that reads ‘Spring 2023 TEG Call’. Below the text, there is another hyperlink formatted in blue underlined text that reads ‘uwgb.edu/catl’.

Do… ✅

Create concise hyperlinks with text that identifies or describes the link in a self-contained way.

Providing meaningful links helps people understand what to expect when they click the link. It also makes it easier for users who rely on assistive technology to navigate between links.

Images

A screenshot showing an image of the Cofrin Library in the Canvas RCE (Rich Content Editor). A text box below the image displays the Canvas HTML editor view of the Cofrin Library image with no descriptive alt text. The image file name consisting of numbers is used as the alt text, and it is underlined in red to indicate that it is not a sufficient description.

Don’t… ❌

Use an image alone to provide information.

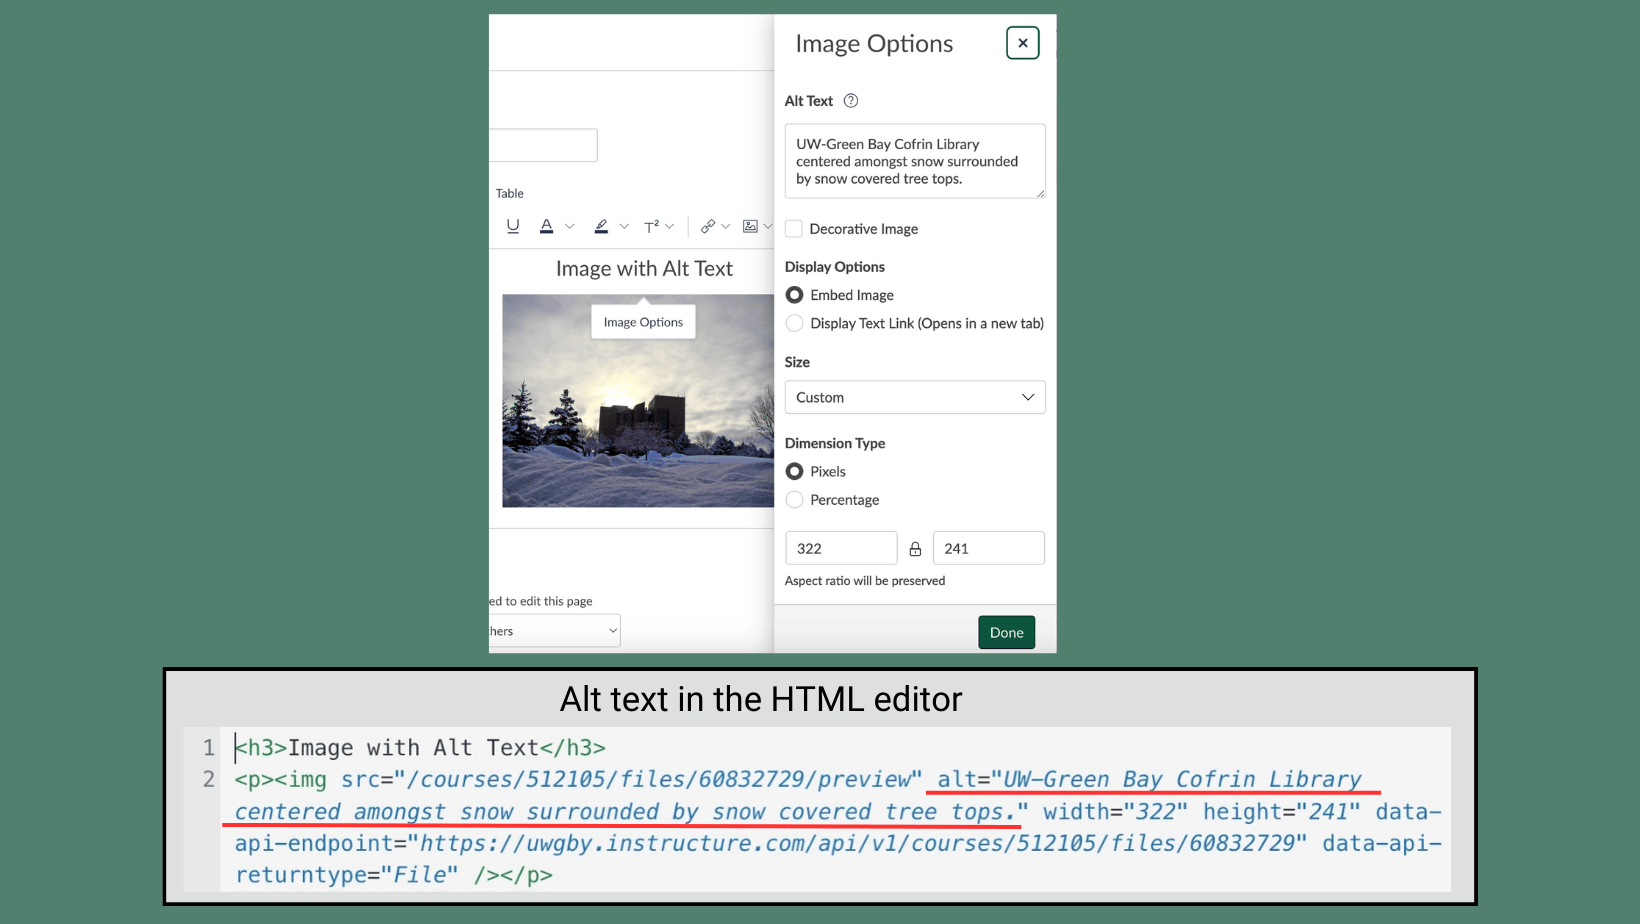
A screenshot of the Canvas RCE. On the left is an image of the Cofrin Library. To the right is the Image Options panel in the Canvas RCE, including a field for alt text. Below that is a screenshot of the Canvas HTML editor view. The alt text for the image is underlined in red and reads 'UW-Green Bay Cofrin Library Centered amongst snow surrounded by snow covered treetops.'

Do… ✅

Add alt text or captions to describe images that convey information in Word, PowerPoint, and Canvas. Mark other images as “decorative” so they are ignored by screen readers.

Providing alt text or a caption helps people with low or no vision understand images.

Audio & Video

Screenshot displaying text that reads ‘Video without CC and Transcript.’ Below the text is a video titled ‘The Kiss by Gustav Klimt: Great Art Explained.’ The video does not display an option to turn on closed captioning.

Don’t… ❌

Share audio or video without closed captioning or another text alternative.

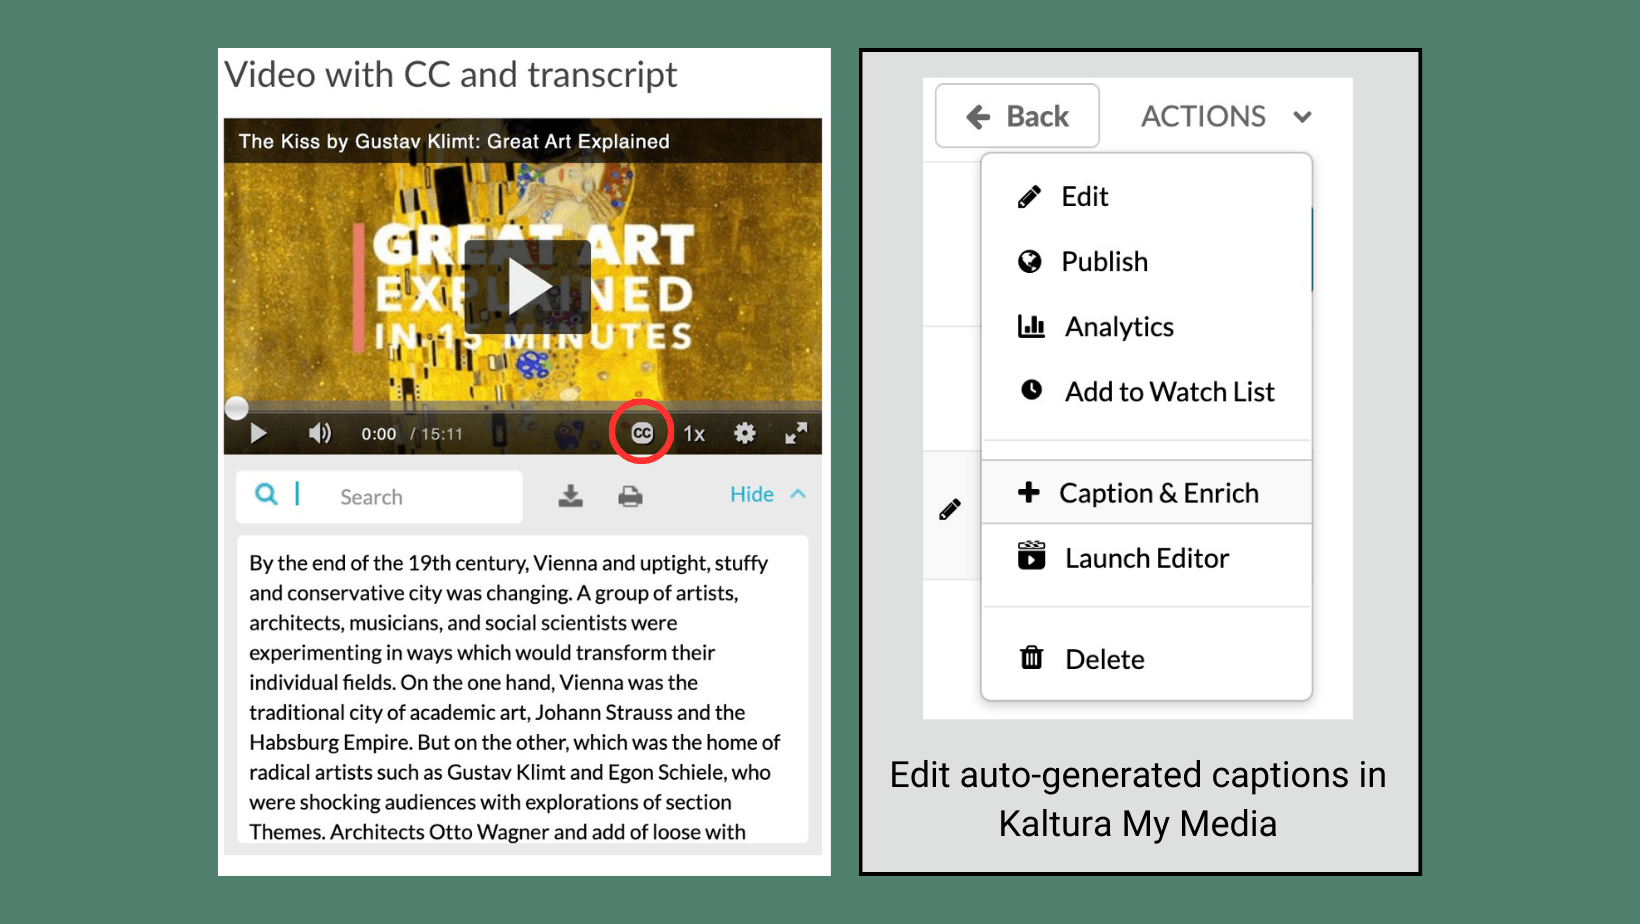
Image containing two screenshots side by side. The first screenshot displays text that reads ‘Video with CC and transcript.’ Below the text is a video titled ‘The Kiss by Gustav Klimt: Great Art Explained’ with a red circle positioned over the closed captioning button on the video player. Below the video is a transcription box. The second screenshot on the right displays the Kaltura My Media options, with the ‘Captions & Enrich’ option highlighted in grey. This option allows users to edit the auto-generated captions in Kaltura My Media.

Do… ✅

Upload your recordings into Kaltura (My Media) for automatic captions or search for media that is captioned. For spoken audio that does not have a visual component, such as a podcast stream, provide a transcript instead.

Captions and transcripts allow people with limited or no hearing to engage with audio and video media, plus they benefit those with other access barriers. Users can also benefit from having a searchable transcript.

Lists

Screenshot of the Canvas Rich Content Editor (RCE) displaying an unformatted numbered list titled ‘List with No Formatting.’ The list contains the items ‘1. Red, 2. Blue, 3. Yellow’ without proper formatting. A gray box outlines the HTML editor view of the Canvas RCE, showing the use of heading 3 tags for the page title and paragraph tags for the list of colors.

Don’t… ❌

Manually type numbers or bullets to create lists.

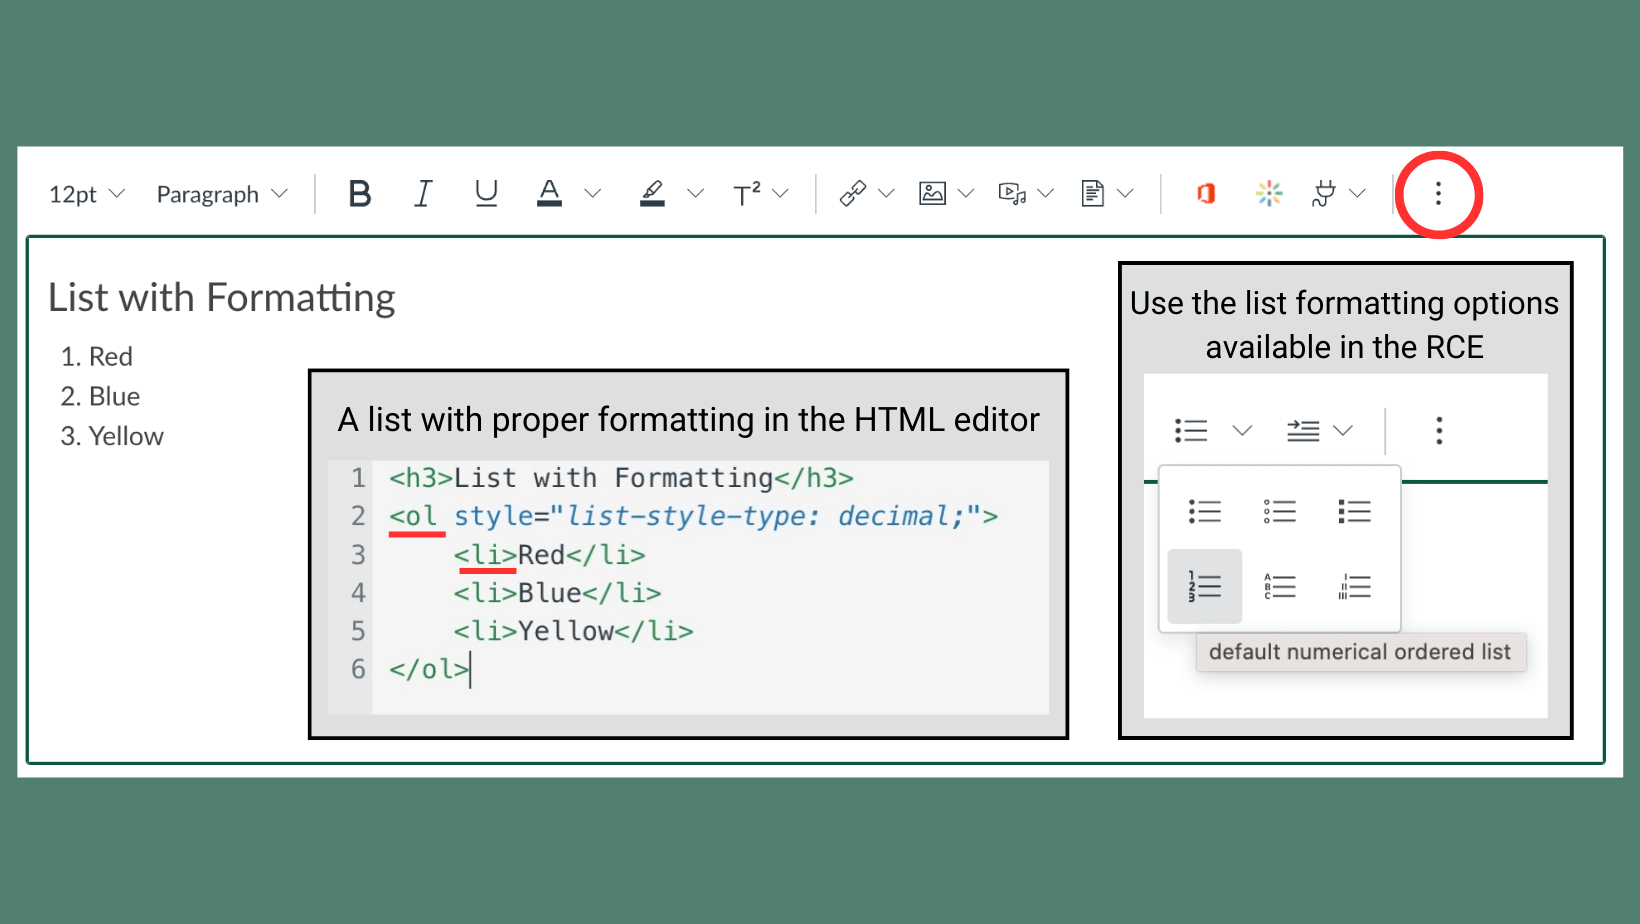
Screenshot of the Canvas Rich Content Editor (RCE) displaying a properly formatted numbered list titled ‘List with Formatting.’ The list contains the items ‘1. Red, 2. Blue, 3. Yellow’ with proper formatting. An inset screenshot shows the HTML editor view of the Canvas RCE, including the tags which give the list proper formatting. Another inset screenshot displays the list formatting options available in the 'more' menu of the RCE toolbar, which is circled in red.

Do… ✅

Use the bullet and numbering buttons in the toolbars of Word, PowerPoint, and the Canvas Rich Content Editor.

The built-in list formatting options in these applications add special HTML code that makes it easier for people who use assistive technologies to navigate a document.

Tables

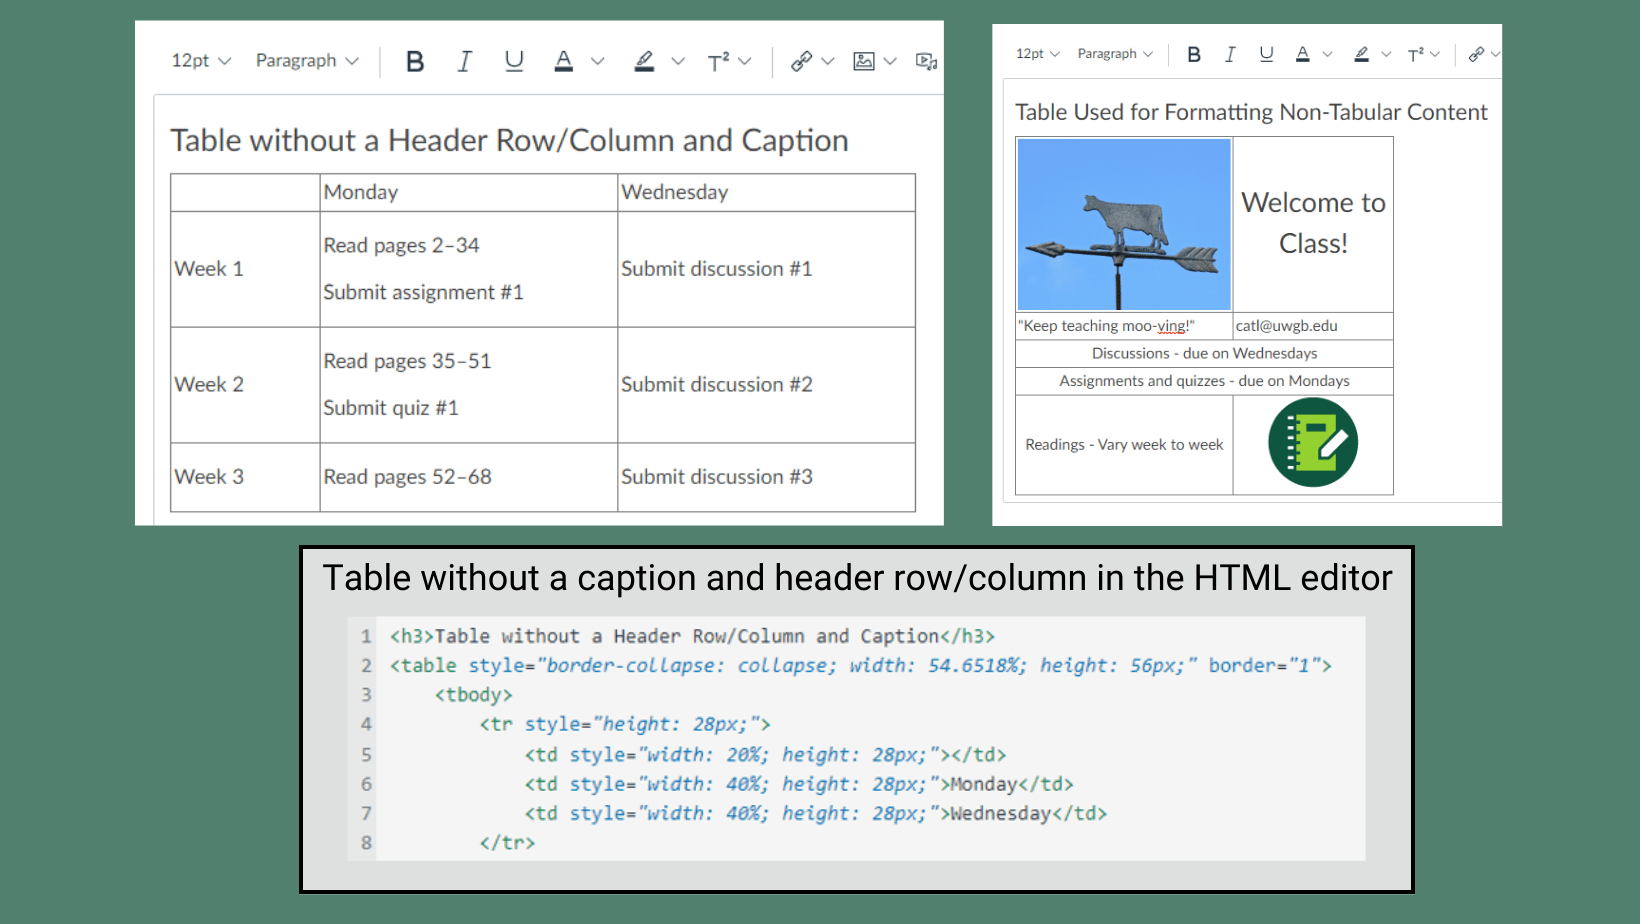
An image containing three screenshots. The first screenshot shows a table in the Canvas RCE. The text above the table reads ‘Table without a Header Row/Column and Caption.’ The table contains syllabus assignments with weeks labeled 1-2 in the right columns, and weekdays Monday and Wednesday in the first row of the table. The second screenshot displays a table in the Canvas RCE. The text above the table reads ‘Table Used for Formatting Non-Tabular Content.’ It seems that this table is intended for formatting purposes and not for displaying tabular data. The third screenshot, positioned below the first two, presents the HTML editor view of the Canvas RCE. The code illustrates a table that lacks a caption and header row/column.

Don’t… ❌

Subdivide and merge cells, omit captions and row/column headers, or use tables as a “hack” for formatting content.

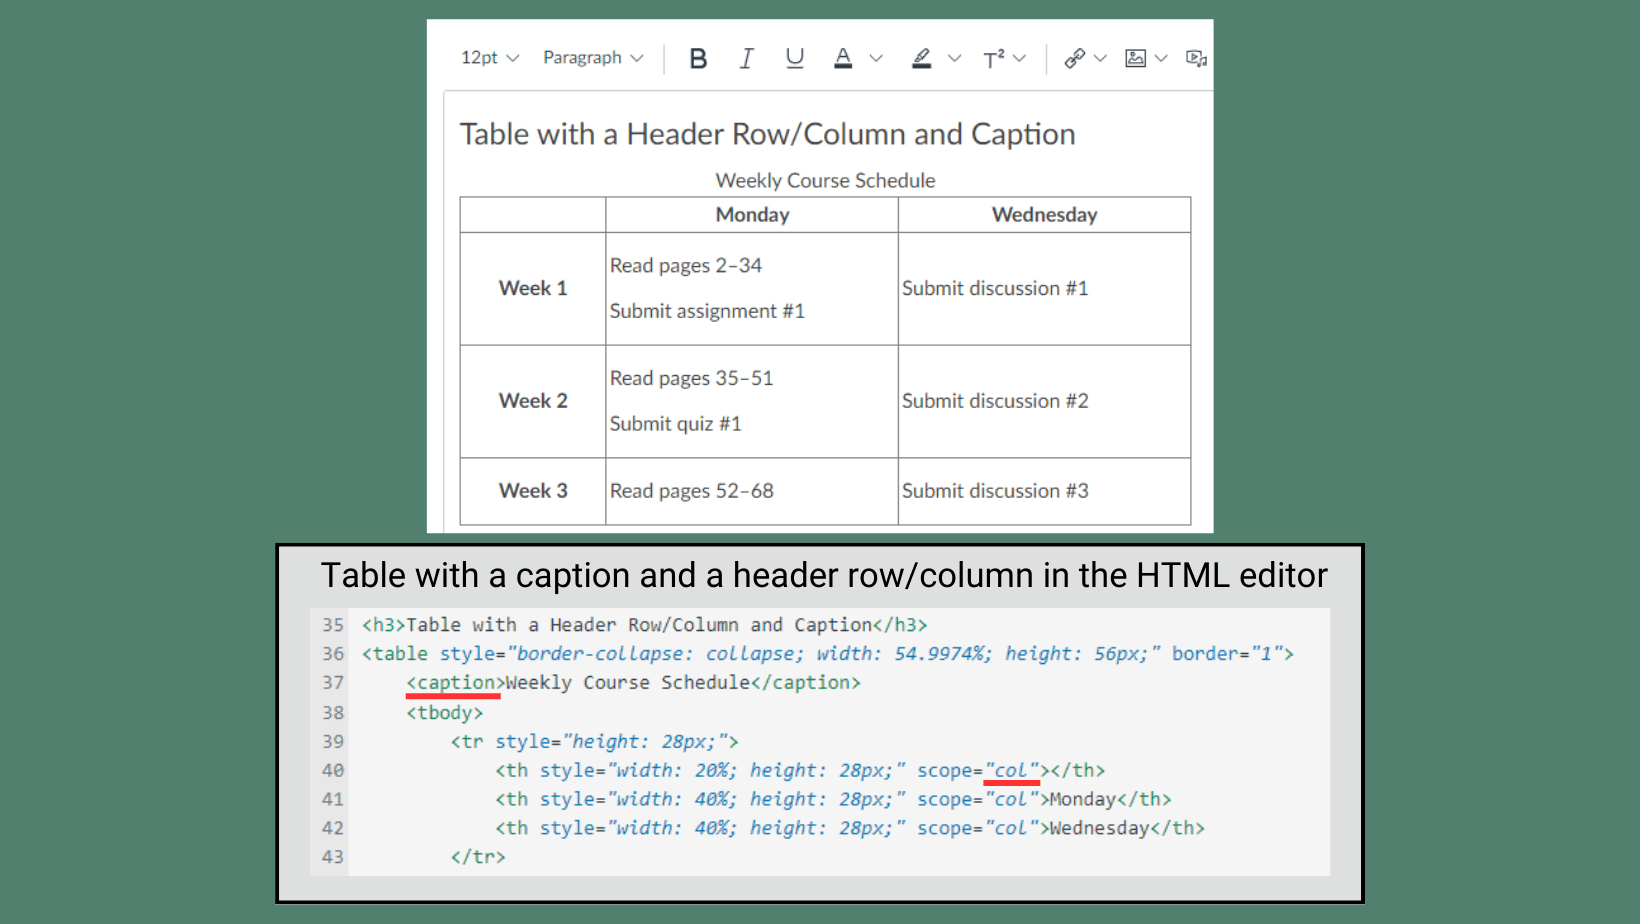
A screenshot depicting a properly formatted table in the Canvas RCE. The table is captioned ‘Weekly Course Schedule,’ with the header row displaying the weekdays Monday and Wednesday, while the header column includes weeks 1-3. A text box below the image displays the HTML editor view of the Canvas RCE. The words 'caption' and 'col' are underlined in the editor, indicating how a table with a caption and header columns are coded.

Do… ✅

Use tables to present data in rows and columns with a logical layout. Use the built-in tools in Word and the accessibility checker in the Canvas Rich Content Editor to include a caption and set a header row and/or header column for data tables. Avoid using tables in PowerPoint if possible, but if you do, follow these guidelines.

Adding a caption and setting a header row/column with the built-in formatting options adds special HTML code that helps users who rely on assistive technology understand and navigate the table. Screen readers may struggle to interpret the layout and hierarchy of the information presented when tables are used to format content other than data. Subdivided and merged cells also pose challenges for users that navigate with a keyboard or rely on screen readers.

Charts & Graphs

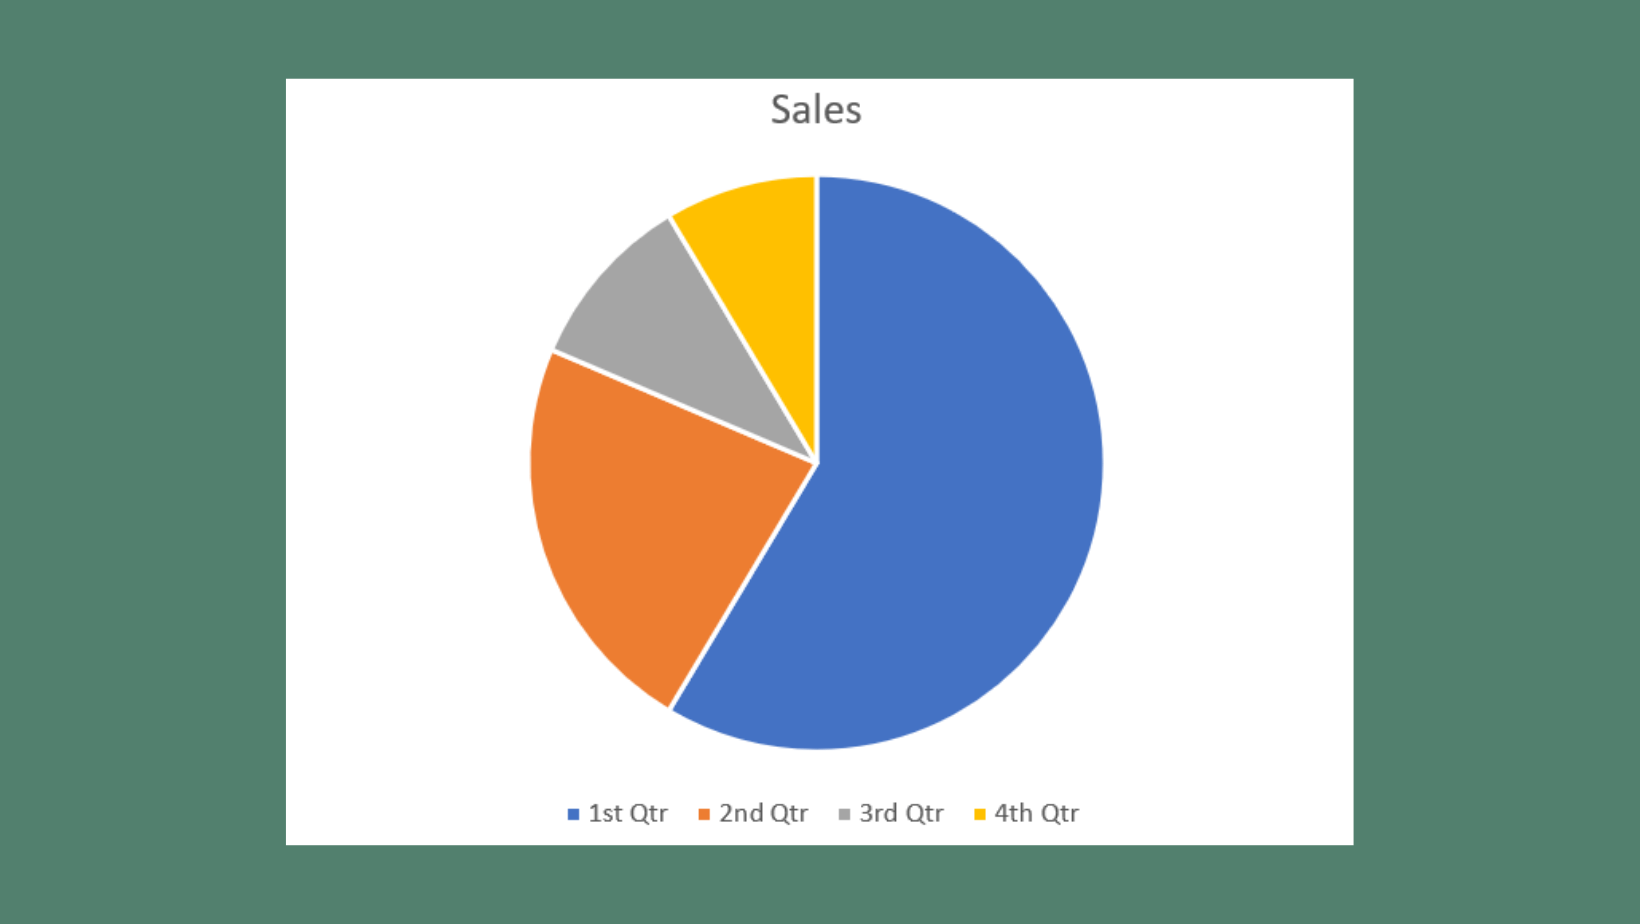
Screenshot of a pie graph titled Sales created in Microsoft Word. The pie graph consists of four slices of different colors, with blue being the largest, followed by orange, gray, and yellow. The legend positioned below the pie graph indicates the blue represents the 1st quarter, orange represents the 2nd quarter, gray represents the 3rd quarter, and yellow represents the 4th quarter.

Don’t… ❌

Use color alone to create meaning in charts and graphs.

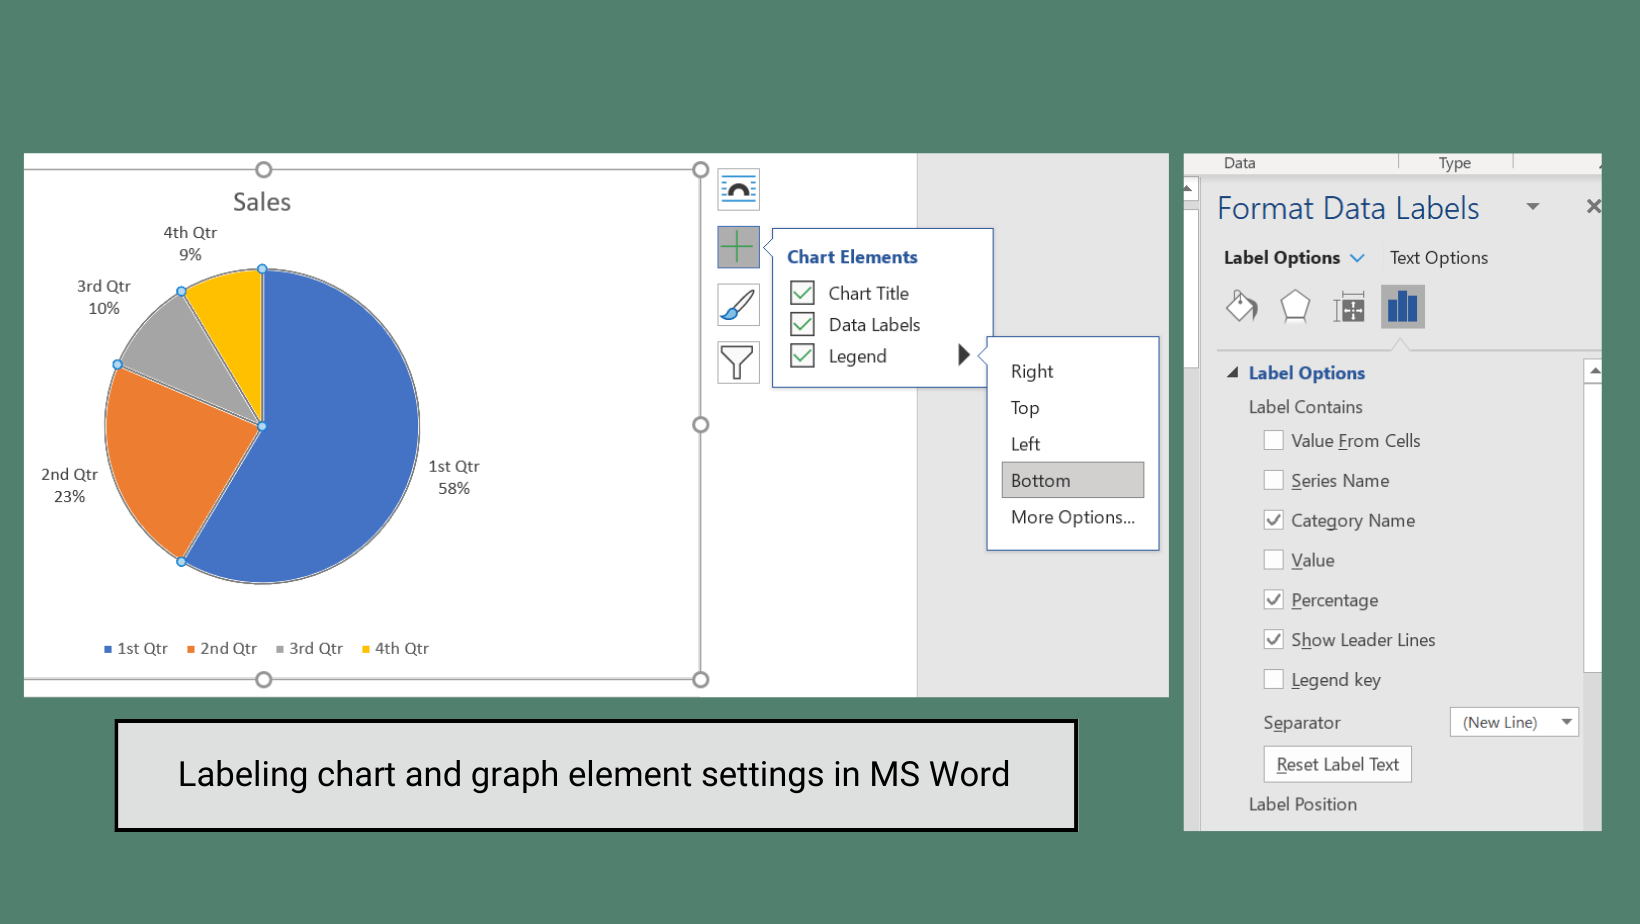
An image containing two screenshots. The first displays a pie chart titled 'Sales' created in Microsoft Word. The Chart Elements settings are displayed with the boxes for title, data labels, and legend all checked. The second screenshot, positioned on the right, displays the Format Data Labels panel, which presents additional label options. A text box below reads 'Labeling chart and graph element settings in MS Word.'

Do… ✅

Directly label elements in charts and graphs and/or use shapes or patterns to differentiate elements.

People who are color blind or who have low vision may have trouble differentiating colors.

Scanned Documents

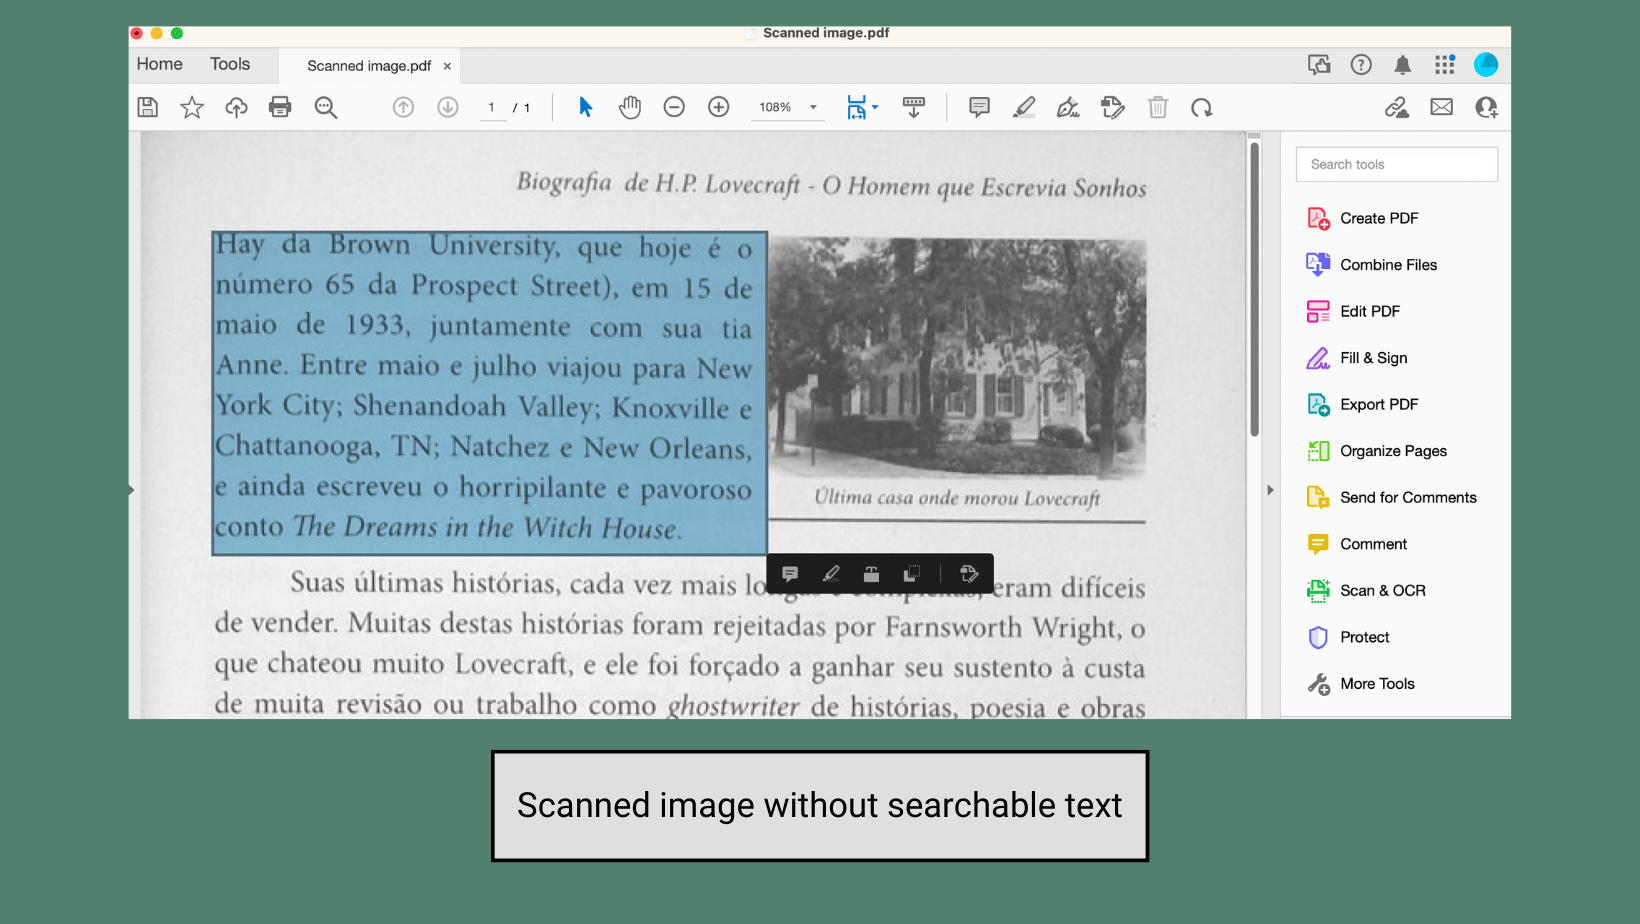
Screenshot of a scanned image of a book page in Adobe Acrobat. A solid blue box overlays a paragraph of text in the image, indicating that each word in the book is not scannable. Below the image, there is a text box that reads “Scanned image without a searchable text.”

Don’t… ❌

Use photos or scans of text without checking for accessibility.

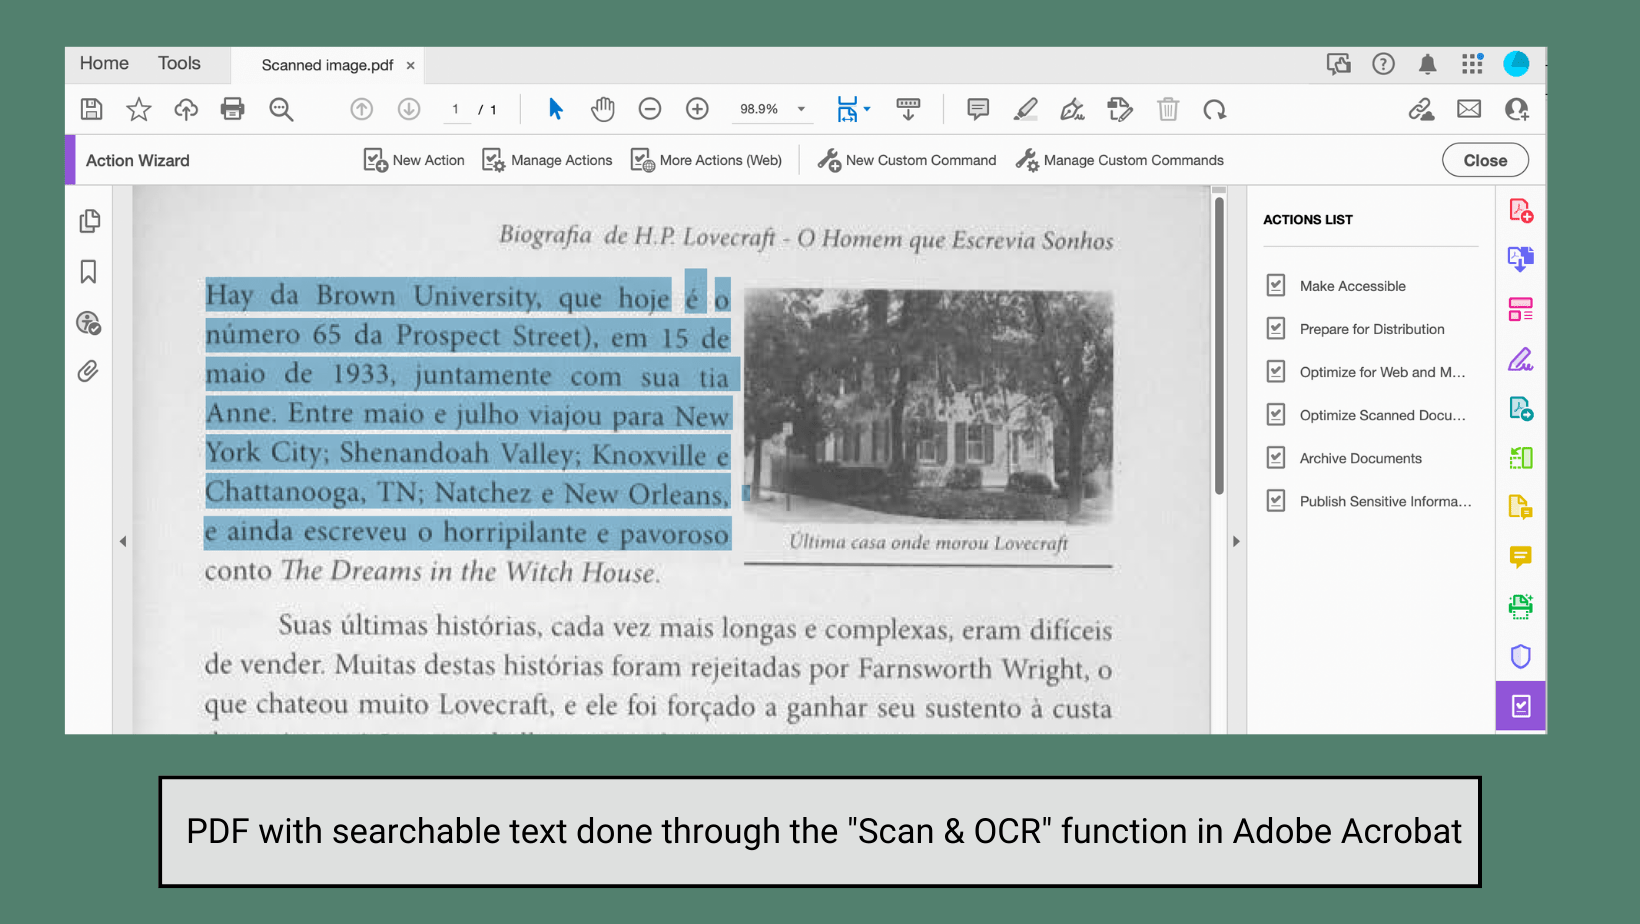
Screenshot of a scanned image of a book page in Adobe Acrobat. Blue highlight overlays a paragraph showing each word is scannable. Below the image, there is a text box that reads 'PDF with searchable text done through the Scan & OCR function in Adobe Acrobat.'

Do… ✅

Find an alternative accessible resource or use the optical character recognition (OCR) tools in Adobe Acrobat to turn a scan into an accessible PDF with selectable text and a logical reading order.

Digital scans of physical texts are encoded like images and are not readable by most screen readers. OCR converts a scanned document into a format that allows people who use assistive technologies to engage with the text, plus it benefits all users by making the document searchable.

Accessibility Checkers

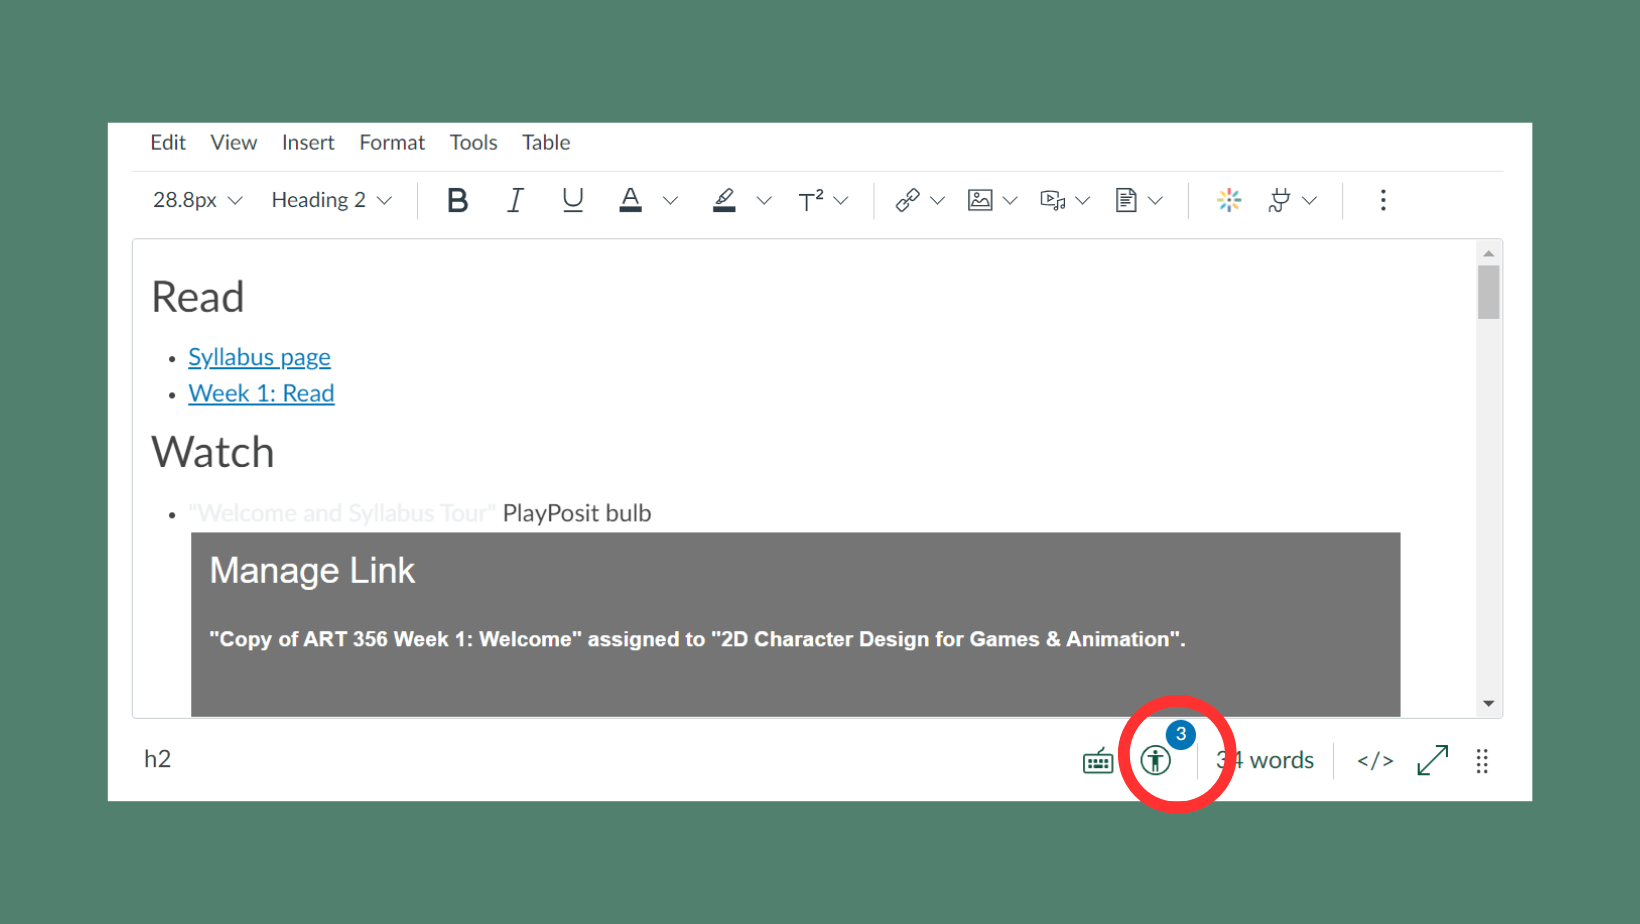
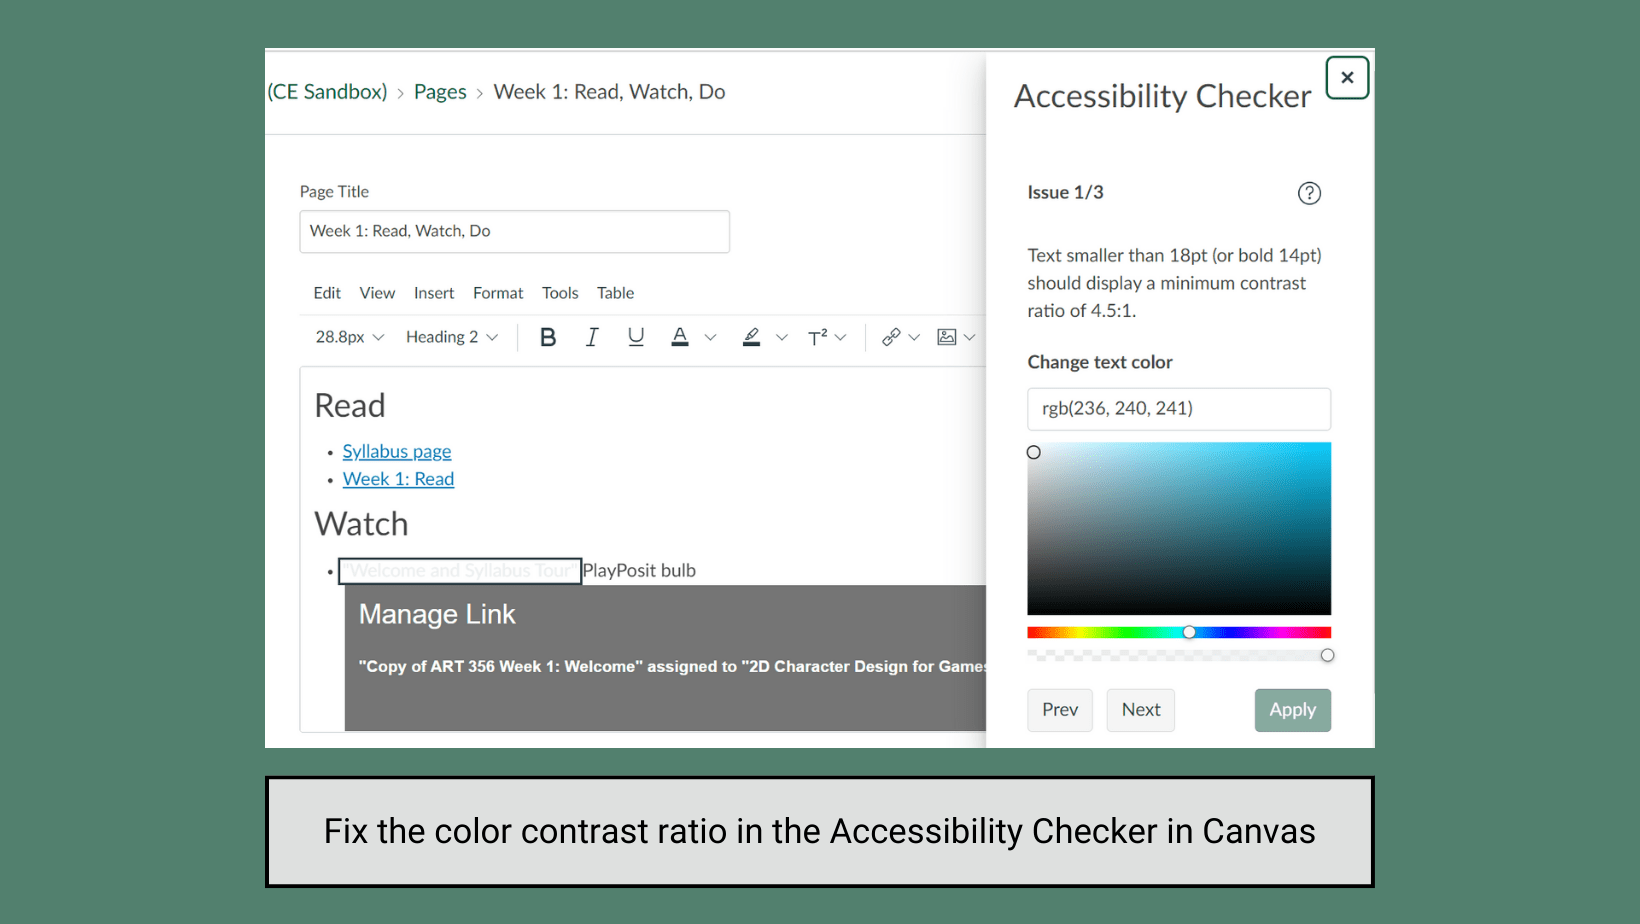
Screenshot of the Canvas RCE displaying some sample headings and text, including text that is light gray and very difficult to read. Under the RCE box, there is a red circle around the accessibility checker indicator, which notifies the editor that there are three accessibility issues within the page.

Don’t… ❌

Ignore the accessibility checker tools in Word, PowerPoint, and Canvas.

Screenshot of the Canvas RCE with the Accessibility Checker panel on the right-hand side. The panel highlights three accessibility issues and provides recommendations for how to fix them. The first issue identified in the panel is the insufficient color contrast ratio for light gray text against a white background.

Do… ✅

Use the accessibility checker tools in Word, PowerPoint, and Canvas to scan for and repair common issues – including many of the issues described in this resource – before exporting, publishing, or sharing materials. For Canvas, you can also use the UDOIT accessibility checker to scan your whole course.

Using built-in accessibility checker tools can help ensure that your course materials meet accessibility standards.

Resources by Application

For accessibility resources specific to Word, PowerPoint, and Canvas, respectively, please see the guides and tip sheets below:

Need Help?

This resource is meant to be a starting point for best practices in digital accessibility, but if you have questions beyond the scope of this guide, we welcome you to reach out to CATL! Send us an email at CATL@uwgb.edu or fill out our consultation request form to discuss digital accessibility in your own courses.

Exams, Alternative Assessments, and the Question of Proctoring

As we dig into the second half of the spring semester, instructors may now be looking at final assessments for the end of the term. During this time, instructors have many different options when they plan out and assign assessments. In this blog post, we’ll be looking at some alternative options for more traditional proctored exams which instructors can incorporate into their courses. 

The purpose of this post isn’t to say that instructors cannot offer traditional quizzes or tests within their courses. Far from it, in fact. Instead, we are offering an alternative to help avoid over-use of quizzes and exams in line with Palloff and Pratt (2013) where the authors state that, “instructors shouldn’t completely avoid the use of tests and quizzes. These assessments can be appropriate but require instructors to be mindful about when and where they use them.” In this vein, below are several suggestions on how to still incorporate quizzes and exams within a course using certain formats or settings within Canvas that create impactful assessments without a reliance on proctoring.  

Alternatives to Proctoring Traditional Exams: Canvas Settings 

For quizzes and tests which contain multiple choice or other auto-graded questions in Canvas, there are several settings instructors can enable to help encourage academic integrity. First, within the settings of a Canvas Classic Quiz, instructors can set answers to be shuffled between quizzes so that each student sees the answer choices in a different order. Selecting Quiz due dates and setting a time limit on a quiz where students must complete the assessment within the given time are also settings which might be of interest. These options are all in the Classic Quiz settings within Canvas.  

Canvas Classic Quizzes Settings showing shuffle questions, time limit, and quiz attempt settings.

You can also create Classic Quiz question banks and then use question groups to pull questions from one or more question banks. With a question group, you can pull all questions from a bank or set a specific number of questions from the question bank to be randomly selected for the question group. Using a question group to randomize questions within a Canvas Quiz can help deter academic dishonesty.  

Another option in Canvas is to have multiple versions of the same quiz, similar to how you might have a test form A, B, and C, for a paper test in a face-to-face course. Use Canvas to set up multiple versions of an exam or quiz, put students into groups, and then assign each group a different version of the assessment. The directions here discuss assigning an individual student to a quiz; however, you can follow the same directions to assign a quiz to a student group instead.  

Alternatives to Proctoring Traditional Exams: Test Formatting 

Besides selecting specific quiz settings in Canvas which can help to discourage academic dishonesty, instructors can also adjust the format of a quiz or test. One option is to allow students to use open notes combined with a specific time limit while taking a quiz or test. Alternatively, the use of open notes can help prioritize question types such as short-answer or essay questions. These question types focus more on application and tend to encourage more honest and original answers from students than multiple-choice and other auto-graded question types. For example, you might have students conduct an analysis of a case study using key concepts introduced in class or explaining how to solve a specific equation. Often, asking students to explain something from their point of view or discuss how they would approach an example case study are questions that are harder to look up in notes or online.  

Another test format you might consider is to ask students to complete an oral exam. UWGB’s own Dr. Amy Kabrhel and Dr. James Kabrhel recently created a blog post discussing their use of oral exams in place of traditional exams for use in virtual classrooms and other remote learning modalities. 

Alternative Assessments Beyond Traditional Exams

For instructors who may wish to incorporate formative or summative assessments that do not follow a quiz or exam structure, we have a summary of a few alternative options. Popular suggestions for such assessments tend to promote group work, peer review, or other collaborative endeavors. Assessments incorporating such activities tend to foster higher order thinking in students and encourage metacognition, personal reflection on learning, and stimulate more active learning.  

The University of North Dakota Teaching Transformation and Development Academy (TTaDA)  and the Charlotte University Center for Teaching and Learning provide some concrete suggestions of specific types of skills-based assessments that transcend proctoring. Some highlights include portfolios where students select examples of their work over the duration of the course to revisit, analyze, and update to submit for a final assessment. This provides students with the opportunity to portray an increased understanding of course materials, as well as showcase specific pieces of work they found interesting or are proud of.  

Another option instead of assigning quizzes and tests is to allow students to create detailed “study guides” for a hypothetical quiz or test, or questions they believe should be used on a quiz or exam based off the materials covered in class. These activities allow students to show how well they understand the topics and concepts covered in class, while also providing instructors with informal feedback about what information students are identifying as important.  

A different suggestion for alternative assessments in STEM courses in particular came from UND TTaDA where they encourage the use of virtual labs. They highlight an open education resource (OER) created by Merlot University showcasing a collection of virtual labs focused on science, engineering, mathematics, and technology disciplines.  

A final tool instructors can use to look at potential alternative assessments is an interactive Reimagine Assessments resource developed by Emory University’s Center for Faculty Development and Excellence. This tool lets instructors see example activities for alternative assessments based on 4 different assessment goals: content mastery, skill development, analysis, and theory. 

Each of these examples have one common theme, and that is that assessments, either traditional quizzes and tests or alternative assessments, should be designed to not only assess a student’s comfort and mastery of specific knowledge covered within a course, but should also aim to help students develop and hone a variety of professional skills. These skills should both aid students within the classroom and also be applicable in the world beyond higher education. Such skills can include but are not limited to information management, project management, time management, individual and group oral presentation skills, collaboration skills, and the potential to practice various media production and editing skills.  

Assessment Wrap Up

The benefits of being very deliberate in the form and function of an assessment are twofold. First, utilizing different Canvas settings, quiz and test formats, or alternative assessment strategies decreases the dependence of instructors on proctoring. In recent years, proctoring software has become a more controversial topic within higher ed, and the ability to utilize in-person proctoring is equally complicated by various factors, the least of which was the recent COVID pandemic. The second benefit is that reassessing and being critical about when, how, and in what form to present formative and summative assessments can help encourage academic honesty amongst students by not only gauging the level of mastery students have reached throughout a course, but also helping students to develop a skill tool set they can use going forward in higher ed and in future careers. 

If you have any questions or ideas about quizzes, tests, or alternative assessments, please reach out to CATL and schedule a consultation. 

New “Atomic Search” Tool Arrives in Canvas

Course Search Image

In January 2023, UW System added a new Atomic Search tool to Canvas. This tool allows both instructors and students to more easily locate content within Canvas courses by searching for keywords. In a Digital Learning Environment student usability study conducted by UW System, students expressed having difficulties locating course content, especially when the layout of the Canvas course was not clear and consistent. Adding a search tool to Canvas was identified as a potential solution. 

Instructors do not have to take any action to enable the Atomic Search tool in their courses. The search tool appears both in the left global navigation bar as a “Search” icon and in course navigation menus as a “Search” link. Starting a search from the global navigation bar will search within all of a user’s enrollments; starting a search from the “Search” link of a course navigation menu will search only within that course. The search tool respects all of the access restrictions an instructor can apply to course content items, so search results shown to a student will only include content that the student could find through normal navigation of the course. 

The most important consideration for instructors is that the addition of a search tool in Canvas heightens the importance of making sure that outdated course content is unpublished or deleted. While preparing a Canvas course, removing an outdated Page from a course module but then forgetting to delete it entirely from the course is an easy mistake to make. With the arrival of a search tool in Canvas, students are now more likely to encounter an old page that you have removed from a module but never deleted or unpublished. Especially in those courses in which you’ve been reusing and iterating upon the same base of Canvas content over several terms, we recommend reviewing your course “index” pages—Announcements, Assignments, Discussions, and Pages—and deleting obsolete content and abandoned drafts. 

Course delete page

While cleaning up your course, remember that removing a page from a module does not also delete that page from the course. Likewise, deleting a module does not delete its contents. Items that module contained will still be found among the Pages, Assignments, and Discussions index pages of the course. Fully deleting a content item from your course can only be done while viewing that item or while viewing the index page for that item’s type—for example, the list of pages you can view by clicking the Pages link in the course navigation menu. Anytime you plan on removing an unneeded content item from a course module it is a good practice to first unpublish that item so that even if you forget to follow up and delete it, students cannot find it. 

After reviewing your course and deleting old content, we recommend running your course’s Link Validator to scan your course for any links which point at now-deleted content. Remove or update any broken links found by the validator tool. 

Please also keep in mind that new content and content changes will not immediately appear in search results. After a change is made to course content, the search tool needs to “re-index” the course before it can deliver updated search results. For an active course, this re-indexing process happens automatically at least once every 10 hours. 

Additional Resources 

Making Impactful Use of Canvas Analytics in Your Course

Like many websites, Canvas collects data from users as they navigate their courses. Thankfully, unlike many websites, Canvas collects this data not for the purpose of selling it to advertisers but for the purpose of presenting it to instructors. Canvas presents collected student activity data in a course page titled “New Analytics,” which contains charts and tables designed to help instructors make use of this data. While New Analytics contains well-organized representations of course data, it does not prescribe specific actions or provide a formula for making use of the data. In this post, we summarize the data available in New Analytics and recommend ways you can interpret it to take actions in your course that can help improve student outcomes. 

Detecting Course Trends 

New Analytics Window

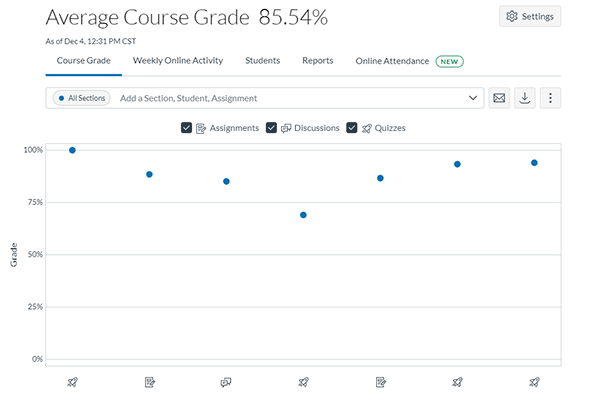
New Analytics can help reveal trends in student achievement from assignment to assignment and student engagement from week to week. After launching New Analytics from the course navigation menu or the button on the right side of the course Home page, you’ll see a series of tabs across the top of the page. The first two tabs, “Course Grade” and “Weekly Online Activity” have data views that can help you identify course trends. The Course Grade tab has a chart which shows the average grade for each assignment in your course. Each assignment in your course will be represented by a dot on this chart. The dot’s position on the y-axis represents the average grade for that assignment. A quick glance at this chart can help you identify the assignments where the class atypically excelled or struggled and help you confirm—or refute—suspicions you developed about performance trends while grading assignments. Thinking critically about why the class might have been more or less successful on a particular assignment can lead to ideas for course design improvements. A close look at a successful assignment may lead to insights on what works well in a course; a close look at a less successful assignment may reveal a need to incorporate scaffolding assignments and additional support. Clicking on an assignment’s dot on the chart will reveal additional statistics, including a grade distribution chart and the number of missing and late submissions. 

Clicking the Weekly Online Activity tab will show a chart of the average page views and course participation actions during each week of the course. Viewing this chart can help you identify whether engagement with your Canvas course is waning, holding steady, or growing. Beneath the chart is a table of course resources which shows how many students have viewed each item, how many overall views it’s received, and how many times a student has participated (a list of the actions Canvas counts as a “participation” can be found in this Canvas guide). You can sort this table by any of its columns to identify which elements of your course get the most and least engagement. If an important resource in your course isn’t garnering as many views as you’d like it to, ask yourself “why?” and consider ways to either guide your students to that resource or phase it out and incorporate its key content into the resources your students are reliably viewing (Clum, 2021). Look at the resources that have gotten the most views and participation and check for commonalities to gain insight on what captures your students’ attention. You can click on any data point in the Weekly Online Activity chart to open a panel that shows activity data filtered for that specific week. The data in this panel can give you an idea of whether students are keeping up with the pace of your course or whether they are still working through older resources. 

Checking on Individual Students 

New Analytics can also help you identify students who may benefit from an intervention from a professional adviser because they have disengaged with your course or never engaged at all. The Students tab of the New Analytics page shows a table with the following statistics for each student: 

  • Current grade 
  • Percentage of assignment submissions made on time 
  • Last date of a participation action 
  • Last date the student viewed any page in your course 
  • Count of total page views 
  • Count of total participation actions 

You can click any column header on this table to sort the table by that column. Looking at this table during the first few weeks of a term and sorting it by “Page Views” can help you quickly identify students who have not engaged with the Canvas course. Students with no or very low page view counts have not engaged with your course. You can issue an ad-hoc alert in EAB Navigate to request that UW-Green Bay’s professional advising team reach out and help set a student on a path to academic success. 

Clicking on a student’s name in this table will open a student-specific data view that shows that particular student’s assignment grades and weekly activity over time. If you’ve noticed a downturn in a student’s performance or engagement, this view can help back up your observations with data. Comparing a student’s assignment grades or activity with the class average can help you contextualize any trends you see. You can view an individual student’s data alongside the class average on the same chart by adding that student to the filter field above the chart on the Course Grade or Weekly Online Activity tabs.

Sending Smart Messages 

Sending Smart Messages in Canvas

New Analytics also makes it easy to send messages to students who fit certain performance or activity criteria. As you explore the Analytics tool in your course, keep an eye out for the message icon that can be found on most of the tabs and panels. Clicking this icon will begin composing a Canvas Inbox message which you can send to students that meet a customizable criterion related to an assignment grade, weekly activity, or engagement with a specific resource. Here are a few examples of the types of messages you can target through New Analytics: 

  • Check-in with students who haven’t yet viewed the course this week 
  • Send congratulations to the students who did well on an assignment 
  • Encourage a growth mindset for students who struggled with an assignment and point them to helpful resources 
  • Remind students who have missing assignments to make a submission 

These quick instructor encouragements and interventions can help your students stay engaged with the course and on-target to reach their goals (Bostwick & Becker-Blease, 2018). Especially in online asynchronous courses, sending these targeted check-in messages can help establish your presence and ensure that students know you care about their success. 

Try It Out!

Coupling the data in Canvas New Analytics with the observations you make while teaching can help you make accurate judgments about what works well and not so well in your course. It can also help you identify when a student needs some additional support, and the incorporated messaging tool makes it easy to follow-up. We encourage you to open the New Analytics page in your Canvas courses, explore the data within, and ask yourself whether what you see aligns with your assumptions of how students experience your course. Try sending a congratulatory message to the students that excelled on an assignment and a friendly reminder message to the students who owe you work. We’d love to hear about your experience exploring and interpreting the data! Please feel free to reach out to us at CATL@uwgb.edu to tell us your story, ask a question, or request a consultation!

References 

  • Bostwick, K. C. P., & Becker-Blease, K. A. (2018). Quick, Easy Mindset Intervention Can Boost Academic Achievement in Large Introductory Psychology Classes. Psychology Learning & Teaching, 17(2), 177–193. https://doi.org/10.1177/1475725718766426 
  • Clum, K. (2021, May 14). Using canvas analytics to support student success. KatieClum.org. Retrieved December 5, 2022, from https://katieclum.org/2021/05/14/using-canvas-analytics-to-support-student-success/