Snapshots that help conserve shorebirds in decline

Scientists collect a snapshot of a bird’s life when they capture, band, and release it. Each coded band and any data collected at the same time like date, location, sex, age etc. are recorded in a database that can be shared by scientists around the world. When the same bird is seen somewhere else, that observation location provides another snapshot that is added to the database, helping scientists to reconstruct the movements of individual birds. This continuously growing database makes it possible to study dispersal and migration, behavior and social structure, life-span and survival rate, reproductive success and population growth.

Environmental Science & Policy Master’s candidate Tom Prestby is observing shorebirds migrating along the lower Bay of Green Bay (Brown County, Wisconsin, USA) in order to provide much needed information about the importance of near shore habitat for numerous species of conservation concern including three species in high peril and 12 in high continental concern.
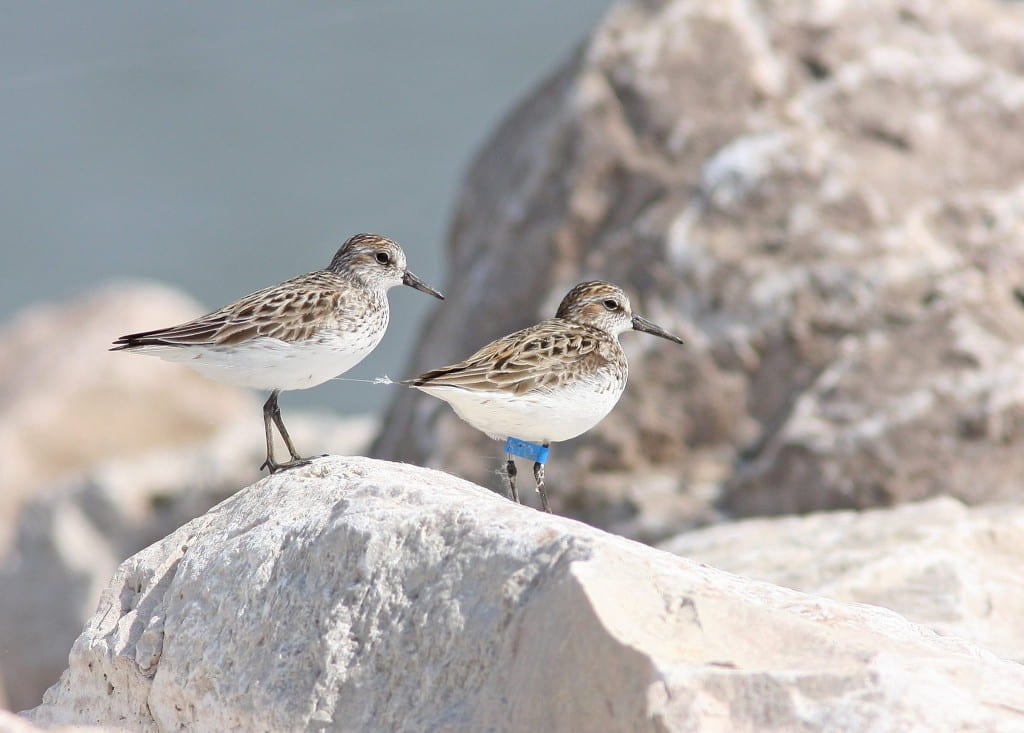
Semipamated Sandpiper photo by Tom Prestby
Semipalmated Sandpipers on the shore of the Bay of Green Bay.

He photographed the Semipalmated Sandpiper shown here in late May 2015 at his research site in Green Bay. The code on the blue band on the bird’s leg allowed him to discover that it was banded on January 14, 2014 in Maranhao, Brazil, and so had traveled nearly 2000 miles to get to Green Bay. Semipalmated Sandpipers, so-named because their toes are webbed for only part of their length, breed on open tundra, so it’s journey is only a little more than half finished. It still must travel another 1200 miles or more to northern Canada and Alaska to breed this summer, resting at along mudflats, sandy beaches, shores of lakes and ponds, and wet meadows. These birds make that incredible 3000 mile journey in only about two months time and rely mostly on stored fat reserves to power them through migration.  Summer is short in the arctic, so after they breed they begin their fall passage in July at a more leisurely pace and typically arrive back in their South American wintering grounds by mid-October.[1]

Unfortunately, this species is on the 2014 State of the Birds Watch List, which lists species most in danger of extinction without significant conservation action. Even though populations appear to be stable at some arctic breeding grounds in Alaska, surveys by researchers in Canada and the United States indicate that the numbers of birds reaching South America wintering grounds have declined by 80% over the last 20 years. Canadian scientist Stephen Brown who has been tracking the birds as they arrive on Coats Island in the far north of Hudson’s Bay explains, “We need to understand the migratory pathways of the species in order to know where the decline is occurring, and what can be done to reverse it.”[2]

Prestby’s observation is helping other scientists to do just that. He is continuing to monitor shorebirds at his research sites including the recently restored Cat Island Chain in person and through the use of remote cameras. He is enthusiastic about his graduate experience. “It is fascinating to be able to look into the life of one of these birds and very satisfying to contribute to a great database!” His master’s research will provide important information about shorebird migration and use of wetlands encircling the bay of Green Bay that will help scientists to better understand and conserve these trans-American travelers.

References

1. All About Birds: http://www.allaboutbirds.org/guide/Semipalmated_Sandpiper/id

2. Manumet Center for Conservation Studies:  https://www.manomet.org/newsletter/first-ever-geolocator-results-semipalmated-sandpiper-show-remarkable-year-long-odyssey


Considering a career in Environmental Science? Learn more educational opportunities for undergraduate and graduate students at the University of Wisconsin–Green Bay, the Original #EcoU!



Assessing Coastal Hazards in Great Lakes Communities

You know those scenes in movies where the main character is standing on the edge of a cliff and all of the sudden the ground falls out beneath him and he drops into the water? In Great Lakes communities, that is an actual concern for some people.

There has been an increasing demand for a new standard of care to be upheld in the Great Lakes. People demanded that we not just minimize harm but also rehabilitate the Great Lakes. In February 2009 President Obama proposed a $475 million Great Lakes Restoration Initiative Action Plan. The Great Lakes Restoration is now a National Priority.

There are five significant ecosystem problems in the Great Lakes.

  • Toxic Substances and Areas of Concern (e.g. pollution prevention and clean up)
  • Invasive Species
  • Nearshore Health and Nonpoint Source Pollution (e.g. reduce polluted runoff from urban, suburban, and agricultural sources)
  • Habitat and Wildlife Protection and Restoration
  • Accountability, Education, Monitoring, Evaluation, Communication, and Partnerships


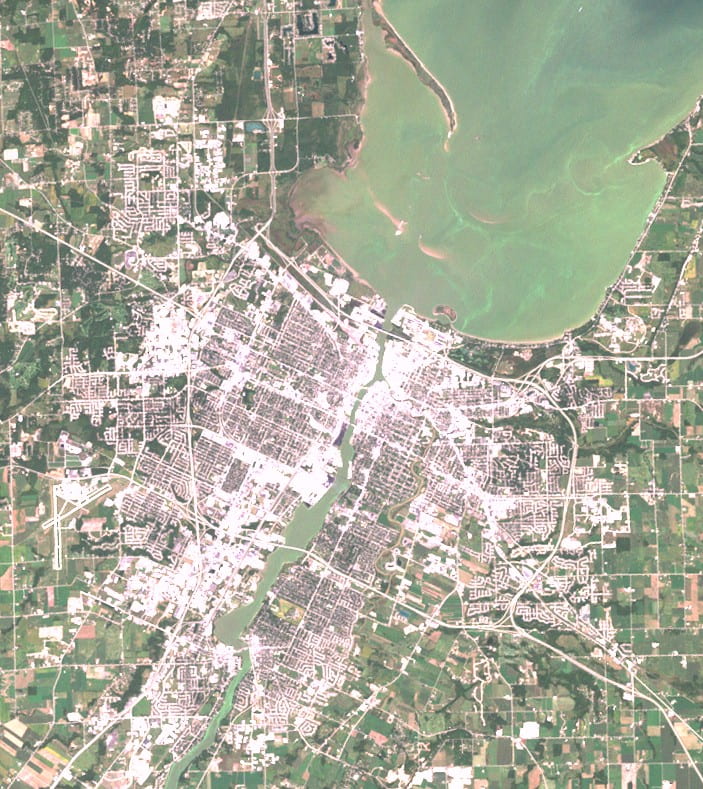
The green color of the bay comes from chlorophyll present in algae.

Where does the Biodiversity Center fit into all of this? The Center is hosting a workshop that will be held at UWGB on June 19, 2012. This workshop focuses on developing online tools to help local decision-makers address hazard related threats and effects of climate change on Great Lakes communities. For example, if a company wanted to build on a bluff near Lake Michigan they would have to talk to a zoning director about how close to the edge of the bluff they can build. The zoning director could use these online tools to figure out how far away from the edge the building has to be so it won’t be at risk of falling into the water someday due to bluff erosion. The goal of this project is for coastal communities to have a better understanding of how they may be impacted by the hazards of a changing climate, and to provide new tools and information for developing adaptive plans.

At this workshop, decision makers will have the opportunity to interact with the online tools. The tools incorporate geospatial data, science-based information, and visualizations. The goal is for decisions-makers to understand and document the effects of “proposed projects” and what liabilities those projects may create for the community. At the workshop, the instructor will propose a project and the users can use the tools to consider if the project will:

  • Accelerate/amplify existing hazards (e.g. erosion and flooding)
  • Increase infrastructure costs and liabilities related to flooding and shoreline protection
  • Worsen resource management challenges associated with water quality, habitat conservation, and the public trust doctrine
  • Decrease the economic, cultural, physical, and ecological resilience of natural and built coastal environments

After the workshop, the users will give their feedback based on their experience with the online program. This feedback is vital in determining how beneficial these online tools will be for local officials in their decision making tasks.

There are four main categories for the online tools.

  • Hazards Management and Planning: this section of the online tools is based on demographic data, land use and parcel data, hazard and flood maps, and climatology data (e.g. extreme temperatures, precipitation change, and flood events).
  • Coastal Erosion and Bluff Recession Prediction: the section demonstrates the connections between weather and climate conditions, coastal recession, bluff retreat hazards, and shoreline management strategies.
  • Coastal Infrastructure Planning: the section focuses on coastal structures including their maintenance costs, effectiveness and regional impacts (e.g. hardened shorelines, recreational and commercial use).
  • Habitat Conservation and Restoration Planning: this section focuses on protecting the region’s key ecosystem resources, especially maintaining the protective and beneficial functions of natural floodplains.

The National Oceanic and Atmospheric Administration (NOAA) Coastal Services Center and Association of State Floodplain Managers are key partners for this project.

How NOT to Control Gypsy Moths

Burlap tree wrap.
Burlap "skirt" tied around young oak.

One of the most common ways to try to control gypsy moth (Lymantria dispar) populations is to wrap tree trunks with control bands. These are simply burlap skirts that are wrapped around the tree. Gypsy moths feed on the leaves of the trees at night and then climb back down the tree trunk and hide under the bark or leaves during the day to avoid predators. The burlap skirts provide an ideal hiding spot for the caterpillars and they will congregate there in large numbers. This makes it easy to capture and kill them during the day. The burlap itself does not act as a trap, and actually increases the moth’s chance of surviving to adulthood, because it prevents predators like Blue Jays from seeing them. Burlap only works if the caterpillars are removed every few days. So if you are going to put up the burlap skirts, you must be committed to checking them every few days and killing the caterpillars by squishing them or by scraping them into a jar of soapy water so they drown.

We saw thousands of male gypsy moth flying around burlap skirted oak trees in one of the parks in Green Bay, Wisconsin in July of 2010. There were many females actually laying their eggs underneath the burlap.  This is unfortunate because now there will be more work to remove egg masses this winter and spring.

Burlap lifted revealing gypsy moth pupae.

Some Links on How to properly use burlap tree skirts:

Male (dark) and female (light) gypsy moths with egg masses.