Recycle Your RECHARGABLE Batteries and Old Cell Phones

Do you have some no longer recharging rechargable batteries or did you replace a cell phone over the holiday break? If so, you have a simple on-campus option to recycle both of these. Our Environmental Health office has set up a number of recycling stations around campus to drop off these items for proper recycling. Just bring in your items, place them in the provided plastic bag, and deposit in the box. Simple!

Locations to find these specialized recycling boxes are:

  • Cofrin Library, 3rd floor
  • Operations Office (IS 1204)
  • HVAC Shop (IS 1067)
  • Grounds (PP 102)
  • Environmental Health office, CL 823

Draft 2013 National Climate Assessment Document Open for Review

Here’s your opportunity to read and review for yourself carefully documented analysis that assesses the impact of climate change over periods up to the next century. After the open review period, during which the National Acadamies of Science and the general public will be able to review and provide comments on the contents of this 1,000 page document, the Third National Climate Assessment Report will be final and presented to the President and Congress.

The 13 federal government departments supporting this effort are:  Commerce, Defense, Energy, Interior, State, Transportation, Health & Human Services, NASA, National Science Foundation, Smithsonian, US AID, Agriculture, and EPA. There are 240 authors presenting detailed review and analysis for this assessment.  

The website to visit to review the document is:  http://ncadac.globalchange.gov/

UW-Green Bay is a signatory to the American College & University Presidents’ Climate Commitment (ACUPCC) – one of the few programs mentioned in the “Mitigation” chapter of this assessment as having a positive impact.

Timothy White, Chancellor of The California State University and ACUPCC chair, provided the following synopsis of the Report Findings:

1. Global climate is changing, and this is apparent across the U.S. in a wide range of observations. The climate change of this past 50 years is due primarily to human activities, predominantly the burning of fossil fuels. U.S. average temperature has increased by about 1.5 degrees F since 1895, with more than 80% of this increase occurring since 1980. The most recent decade was the nation’s warmest on record. Because human-induced warming is superimposed on a naturally varying climate, rising temperatures are not evenly distributed across the country or over time (Ch. 2).

2. Some extreme weather and climate events have increased in recent decades, and there is new and stronger evidence that many of these increases are related to human activities. Changes in extreme events are the primary way in which  most people experience climate change. Human-induced climate change has already increased the frequency and intensity of some extremes. Over the last 50 years, much of the U.S. has seen an increase in prolonged stretches of excessively high temperatures, more heavy downpours, and in some regions more severe droughts (Ch. 2, 16, 17, 18, 19, 20, 23).

3. Human-induced climate change is projected to continue and accelerate significantly if emissions of heat-trapping gases continue to increase. Heat-trapping gases already in the atmosphere have committed us to a hotter future with more climate-related impacts over the next few decades. The magnitude of climate change beyond the next few decades depends primarily on the amount of heat-trapping gases emitted globally, now and in the future (Ch. 2, 27).

4. Impacts related to climate change are already evident in many sectors and are expected to become increasingly challenging across the nation throughout this century and beyond. Climate change is already affecting human health, infrastructure, water resources, agriculture, energy, the natural environment, and other factors – locally, nationally, and internationally. Climate change interacts with other environmental and societal factors in a variety of ways that either moderate or exacerbate the ultimate impacts. The types and magnitudes of these effects vary across the nation and through time. Several populations – including children, the elderly, the sick, the poor, tribes and other indigenous people –  are especially vulnerable to one or more aspects of climate change. There is mounting evidence that the costs to the nation are already high and will increase very substantially in the future, unless global emissions of heat-trapping gases are strongly reduced (Ch. 3, 4, 5, 6, 7, 8, 9, 10, 11, 12, 13, 14, 16, 17, 18, 19, 20, 21, 22, 23, 24, 25).

5. Climate change threatens human health and well-being in many ways, including impacts from increase extreme weather events, wildfire, decreased air quality, diseases transmitted by insects, food and water, and threats to mental health. Climate change is increasing the risks of heat stress, respiratory stress from poor air quality, and the spread of waterborne diseases. Food security is emerging as an issue of concern, both within the U.S. and across the globe, and is affected by climate change. Large-scale changes in the environment due to climate change and extreme weather events are also increasing the risk of the emergence or reemergence of unfamiliar health threats (Ch. 2, 6, 9, 11, 12, 16, 19, 20, 22, 23).

6. Infrastructure across the U.S. is being adversely affected by phenomena associated with climate change, including sea level rise, storm surge, heavy downpours, and extreme heat. Sea level rise and storm surges, in combination with the pattern of heavy development in coastal areas, are already resulting in damage to infrastructure such as roads, buildings, prots, and energy facilities. Infrastructure associated with military installations is also at risk from climate change impacts. Floods along the nation’s rivers, inside cities, and on lakes following heavy downpours, prolonged rains and rapid melting of snowpack are damaging infrastructure in towns and cities, farmlands, and a variety of other places across the nation. Extreme heat is damaging transportation infrastructure such as roads, rail lines, and airport runways. Rapid warming in Alaska has resulted in infrastructure impacts due to thawing of permafrost and the loss of coastal sea ice that once protected shorelines from storms and wave-driven coastal erosion (Ch. 2, 3, 5, 6, 11, 16, 17, 18, 19, 20, 21, 22, 23, 25).

7. Reliability of water supplies is being reduced by climate change in a variety of ways that affect ecosystems and livelihoods in many regions, particularly the Southwest, the Great Plains, the Southeast, and the islands of the Caribbean and the Pacific, including the state of Hawai’i. Surface and groundwater supplies in many regions are already stressed by increasing demand for water as well as declining runoff and groundwater recharge. In many regions, climate change increases the likelihood of water shortages and competitions for water amount agricultural, municipal, and environmental uses. The western U.W. relies heavily on mountain snowpack for water storage, and spring snowpack is declining in most of the West. There is an increasing risk of seasonal water shortages in many parts of the U.S., even where total precipitation is projected to increase. Water quality challenges are also increasing, particularly sediment and contaminant concentrations after heavy downpours (Ch. 2, 3, 12, 16, 17, 18, 19, 20, 21, 23).

8. Adverse impacts to crops and livestock over the next 100 years are expected. Over the next 25 years or so, the agriculture sector is projected to be relatively resilient, even though there will be increasing disruptions from extreme heat, drought, and heavy downpours. U.S. food security and farm incomes will also depend on how agricultural systems adapt to climate changes in other regions of the world. Near-term resilience of U.S. agriculture is enhanced by adaptive actions, including expansion of irrigated acreage in response to drought, regional shifts in crops and cropped acreage, continued technological advancements, and other adjustments. By mid-century, however, when temperature increases and precipitation extremes are further intensified, yields of major U.S. crops are expected to decline, threatening both U.S. and international food security. The U.S. food system also depends on imports, so food security and commodity pricing will be affected by agricultural adaptation to climate changes and other conditions around the world (Ch. 2, 6, 12, 13, 14, 18, 19).

9. Natural ecosystems are being directly affected by climate change, including changes in biodiversity and location of species. As a result, the capacity of ecosystems to moderate the consequences of disturbances such as droughts, floods, and severe storms is being diminished. In addition to climate changes that directly affect habitats, events such as droughts, floods, wildfires, and pest outbreaks associated with climate change are already disrupting ecosystem structures and functions in a variety of direct and indirect ways. These changes limit the capacity of ecosystems such as forests, barrier beaches, and coastal-and freshwater wetlands to adapt and continue to play important roles in reducing the impacts of these extreme events on infrastructure, human communities, and other valued resources (Ch. 2, 3, 6, 7, 8, 10, 11, 14, 15, 19, 25).

10. Life in the oceans is changing as ocean waters become warmer and more acidic. Warming ocean waters and ocean acidification across the globe and within U.S. marine territories are broadly affecting marine life. Warmer and more acidic waters are changing the distribution of fish and other mobile sea life, and stressing those, such as corals, that cannot move. Warmer and more acidic ocean waters combine with other stresses, such as overfishing and coastal and marine pollution, to negatively affect marine-based food production and fishing communities (Ch. 2, 23, 24, 25).

11. Planning for adaptation (to address and prepare for impacts) and mitigation (to reduce emissions) in increasing, but progress with implementation is limited. In recent years, climate adaptation and mitigation activities have begun to emerge in many sectors and at all levels of government; however barriers to implementation of these activities are significant. The level of current efforts is insufficient to avoid increasingly serious impacts of climate change that have large social, environmental, and economic consequences. Well-planned and implemented actions to limit emissions and increase resilience to impacts that are unavoidable can improve public health, economic development opportunities, natural system protection, and overall quality of life (Ch. 6, 7, 8, 9, 10, 13, 15, 26, 27, 28).

Starbucks Introduces $1 Reusable Cup to Cut Down on Waste

from CNN.com; posted Jan. 3, 2013

Starting Thursday (Jan. 3), Starbucks customers will have the option to save their planet – and their wallets – a dime at a time. The coffee giant is offering $1 plastic cups, which can be reused for drink purchases at a discount of ten cents.

Jim Hanna, the director of environmental affairs at Starbucks, told USA Today that while the company has sold reusable tumblers for some time and offered the ten cent discount, he expects that the modest price of its new one, available at company-owned stores in the U.S. and Canada, will encourage customers to take action more frequently. The new effort comes largely in response to consumer criticism over the volume of paper coffee cup waste – approximately 4 billion cups globally each year – generated by Starbucks.

The responsibility section of Starbucks’ website details the company’s effort to work with vendors and local authorities to get more of its paper cups recycled, and to host recurring “Cup Summits” collaborating on the issue with industry leaders from MIT, Tim Horton’s, Georgia-Pacific and Action Carting Environmental Services. By 2015, Starbucks plans to have front-of-store recycling in all its company-owned locations.

According to a 2011 report issued by Starbucks, that year, customers used personal tumblers more than 34  million times – nearly 2% of all beverages served in global company-owned stroes. While this represented a 55% incrase in personal tumbler use from 2008’s tally, Starbucks admitted to challenges in tracking cup use both in and away from their stores, and reduced the company’s goal of 25% reusable cups by 2015 to 5%.

The reusable cups are made in China, and have fill lines inside denoting “tall,” “grande,” and “venti”-sized drinks. The cups will be rinsed with boiling water by Starbucks employees before they’re refilled, reducing the risk of cross-contamination, but a least one more challenge remains: will customers actually remember to bring them into the store?

Remember…you get a much better deal when you bring a reusable mug to the Common Grounds on campus for a cup of joe – no measly dime, but 25% off the purchase price!

The True Cost of Clothing

Published on Greenbiz.com, Dec. 12, 2012; Author: Richard Mattison

“Past True Cost columns have relied on generic product data. This month, we provide a case study based on actual product data following the work PUMA has done to identify the environmental price tag of its products.

PUMA wanted to understand whether its efforts to develop more sustainable clothing products had in fact been making a positive difference after all environmental impacts across the full product lifecycle had been taken into account.

The PUMA Product Enviromental Profit and Loss (EP&L) analysis compares a pair of PUMA’s conventional Suede sneakers versus a pair of PUMA’s soon-to-be-launched biodegradable InCycle Basket sneakers.

The analysis takes account of the environmental impacts caused by greenhouse gas (GHG) emissions, waste and air pollution, as well as the use of natural resources such as water and land along the entire value chain, from the generation of raw materials and production processes to the consumer phase where the product is used, washed, dried, ironed and ultimately discarded.

The results of this analysis confirm that PUMA’s focus in creating a sustainable footwear alternative was not in vain. The enviromental impacts of the conventional PUMA Suede sneaker amounted to €4.29 ($5.61) per pair, while those of the InCycle basket sneaker were only €2.95 ($3.86) – around a third less environmental damage across the product lifecycle.

How was this acheived?

Previous EP&L analysis of PUMA’s operations and supply chain identified that its environmental impacts were mainly concentrated in the raw material production and processing tiers of PUMA’s supply chain. This provided important focus areas for environmental optimization.

Greenhouse gases. Substituting the conventional PUMA Suede leather uppers for a combination organic cotton and linen led to significant GHG savings for the InCycle sneaker, as the GHGs associated with rearing cattle for leather production far exceed those related to cotton farming. Further GHG savings resulted from a switch to organic cotton which avoids the use of GHG-intensive synthetic fertilizers. And finally at the end-of-life, the InCycle Basket has the lowest GHG emissions because it is 100 percent compostable, whereas the traditional PUMA Suede is not currently recyclable and cannot be composted due to chemicals used in the production of the Suede. The PUMA Suede will ultimately end up in a landfill or incinerator.

All tallied, GHG emissions from the production, consumer use and end-of-life of the PUMA InCycle sneaker cause around 35 percent less environmental costs from GHG emissions than the conventional PUMA Suede.

Water. The InCycle sneaker outperformed the PUMA Suede with 21 percent less water consumption. This can be linked directly to leather, which requires more water during the tanning and processing phase than cotton. The PUMA InCycle sneaker does, however, have a higher water cost during the raw material phase since organic cotton farming is more intensive than cattle ranching.

Land Use. Choosing which country products and services are sourced from has a direct impact on land use valuation, since this relates to the types of ecosystems that are affected. The analysis found that the InCycle sneaker has a 20 percent reduced enviromental cost from land use because a far larger area of agricultural land is required for the production of leather, in particular related to cattle farming, than for the production of cotton.

Waste.  When analyzing waste generation throughout the product life-cycle, the InCycle sneaker creates approximately one third of what the PUMA Suede generates. The main savings are at the raw-material production and processing stages, where cotton generates far less waste than leather. Additionally, due to the compostable nature of the PUMA InCycle, there aren’t any environmental costs associated with waste at end-of-life.

Air Pollution. The PUMA InCycle sneaker has a 14 percent higher environmental cost related to air pollution than the PUMA Suede because the energy required to convert cotton into thread and weave it into fabric is higher than the energy necessary to process leather.

However, applying a financial value to these competing environmental costs quickly revealed that the negative air pollution impacts were easily offset by the much more significant savings in other areas.

Focusing on Waste

To clear the waste that 100,000 pairs of conventional sneakers cause during the production process and the consumer life, 31 waste disposal trucks are needed. Now consider this against the billions of sneakers made each year – around 21 billion pairs in 2011 alone – and you will begin to see the tip of the iceberg of what needs to change.”

To read more and understand the impact of true cost accounting, read the rest of the article here.

Reduce, Reuse, Recycle for the Holidays

Tis’ the season for gift-giving, gift-receiving and, as a consequence, waste generation. Here’s some tips to consider that will put a greener-tinge to your holiday season.

  • Many thousands of paper and plast shopping bags end up in landfills every year. Reduce the number of bags thrown out by bringing reusable bags for holiday gift shopping. Tell store clerks you don’t need a bag for small or oversized purchases.
  • Wrap gifts in recycled or reused wrapping paper or funny papers. Or use a used brown grocery bag you/your kids decorate for the occassion. Also remember to save or recycle used wrapping paper.
  • Give a gift card. More than two-thirds of American consumers purchase at least one gift card as a holidy present for a loved one. They’re appreciated, they never expire, and they require no fancy gift-wrapping.
  • Say “Happy Holidays” over the phone or internet. An estiamted 2.6 billion holiday cards are sold each year in the United States, enough to fill a football field 10 stories high. If every family reduced thier mailing list by just one card, the nationw ould save 50,000 cubic yards of paper. If you have Internet access, consider sending electronic holiday cards this year. Check the selection at commercial sites like hallmark.com, bluemountain.com, or 123christmascards.com.  You can also check charitable support groups like care2.com or conservation groups like The Nature Conservancy.
  • Repurpose old holiday cards – donate your old cards to a nursery or day care center for arts and crafts projects. Or, cut up cards to be used as gift tags, bookmarks, greeting cards, placemats, or decorations. Used cards, especially those with large pictures to cut out, can also be used as decorations. Just put a hole at the top of the card and knot a piece of string to lace through the hole to hang on next year’s Christmas tree, door handles, etc.
  • Recycle that tree. Nationwide, an estimated 15 million used Christmas trees end up in landfills. Remember to recycle trees locally or turn them into mulch for water conservation and weed control in the garden. Reuse branches to make colorful holiday wreaths and separate the pine needles from tree branches to create tree-scented sachet bags. Or, consider an artificial tree or a “living” tree that can be replanted in the yard.
  • Make room for new gadgets and toys. Outgrown toys, clothes and furniture may be donated to charitable groups like Goodwill Industries, The Salvation Army, American Cancer Society, or many local shelters and thrift stores.
  • Shopping for a new cell phone? Americans ten to upgrade their cell phones every 18 to 24 months, and the U.S. EPA estimates Americans discard 125 million old cell phones annually, creating 65,000 tons of waste. What’s more, the old phones contain hazardous materials- including mercury, cadmium, and arsenic – that cannot be accepted at landfills. Look up cell phone recycling on the Internet and you’ll get back both sites where you can sell your phone as well as organizations that gratefully accept your old cell phone donation.
  • Buy reusable batteries. About 40 percent of all battery sales occur during the holiday season. Consider purchasing rechargeable batteries instead as they can be used again and again. And don’t forget:  at the end of their life, rechargeable batteries need to be properly recycled and not discarded in the trash. Check out call2recycle.org for battery recycling locations in the area.  
  • Consider the durability of a product before you buy it as a gift. Cheaper, less durable items often wear out quickly, creating waste and costing you money.
  • When buying gifts, check product labels to determine an item’s recyclability and whether it is made from recycled materials. Buying recycled encourages manufacturers to make more recycled-content products available.
  • Turn off or unplug holiday lights during the day. Doing so will not only save energy, but will also help your lights last longer.
  • Recycle packing peanuts. Check with local postal shipping stores to see if they will accept foam peanuts for recycling. Call “The Peanut Hotline” at 800-828-2214 to find the nearest location, or check the Plastic Loose Fill Council website for a drop-off location near you.

Sources:  U.S. EPA and Cal Recycle

Warming Lakes: Climate Change and Variability Drive Low Water Levels on the Great Lakes

Note: If you venture up to the 8th floor of the Cofrin Library and take a look out at Green Bay, you will see sand bars that normally are under at least a few inches of water. This article from Newswatch: National Geographic details some the possible explanations of what we’re seeing.

By Lisa Borre, published Nov. 20, 2012

“For people living around the Great Lakes, water levels this past month have appeared much lower than many will remember. The upper Great Lakes reached near-record low water levels in October. This was most evident on Lake Michigan and Huron, where lake levels dropped to less than two inches (4 cm) above record lows and 28 inches (71 cm) below the long-term average. All five lakes, plus Lake St. Clair, remain below their long-term averages.

Rock and sand recently exposed by low water levels made stretches of the northern Lake Michigan shoreline look like a moonscape. Recreational boaters had trouble navigating the shallow water this fall, and shipping companies lightened loads to compensate for low water. Lakes Michigan and Huron hovered just above a record low set nearly 50 years ago, and Lake Superior was within five inches (11 cm) of record lows set in 1975.

A 2002 National Geographic magazine story, Down the Drain: The Incredible Shrinking Great Lakes, documents declining lake levels and the potential economic and ecological consequences for the region. Ten years later, the story continues to unfold, as water levels remain lower than normal.

Experts blames the recent low water on the unusually warm and dry weather over the past year. Rain events in October, including Hurricane Sandy, delayed the inevitable, but forecasters predict Lakes Superior, Michigan, and Huron will likely reach historic low levels in the late fall or winter, a time of year that the lakes are normally already dropping due to high rates of evaporation.

Low water levels are not the only climate-related trend being observed on the Great Lakes. Ice cover is also declining. The Great Lakes have lost 71% of their ice cover since 1973, according to a study by the Great Lakes Environmental Research Laboratory (GLERL). This past winter, the Great Lakes, including Lake Superior, were virtually ice free with just 5% ice coverage, the second lowest on record. Similar to the global assessment conducted in 2000, loss of ice cover is being reported on lakes throughout North America, Europe, and Asia.

Summer lake temperatures are also on the rise. As mentioned in one of my previous posts about warming lakes, the Great Lakes are among many lakes in the northern hemisphere experiencing a rapid warming trend. Lake Superior, the largest freshwater lake in the world by surface area and third largest by volume (after Baikal in Siberia and Tanganyka in Africa), is also one of the most rapidly warming lakes in the world.

Because lower lake levels are considered one of the potential consequences of climate change, I was curious to find out whether there was any connections to what is being observed on the Great Lakes.

I recently had the opportunity to talk with John Lenters, a lake and climate scientist, while we attended a meeting of the Global Lake Ecological Observatory Network (GLEON) in Mulranny, Ireland. When comparing notes about our personal connections to Lake Superior, I learned that this accomplished scientist, with a laid-back Midwestern manner, first fell in love with the Big Lakes as a 14-year-old boy while on a backpacking trip in Isle Royale National Park. “Although the trip was grueling, I was awed by Lake Superior and realized I wanted to study lakes,” Lenters told me.

Now an associate professor at the University of Nebraska – Lincoln (UNL), Lenters studies lake-climate interactions in the Great Lakes region, the Alaskan Arctic, and western Nebraska. Given the global implications of his research, he joined GLEON in 2008 and helped to form the new Global Lake Temperature Collaboration (GLTC), hosting their first meeting at UNL, this past June. With his boyhood dream as inspiration, he and his collaborators are leading the way to learning more about how climate change is affecting lakes around the world, including the Great Lakes.

On Lake Superior, Lenters and his collaborators are studying the interactions among evaporation, ice cover, and water temperature. Their research builds on works by others in the region (and elsewhere) and provides new insight on factors affecting water levels.”

Surface Water Temperatures Increasing on the Great Lakes

Is it or isn’t it? Click here to read the rest of the article.

Preparing for New Blooms on the Student Services Plaza

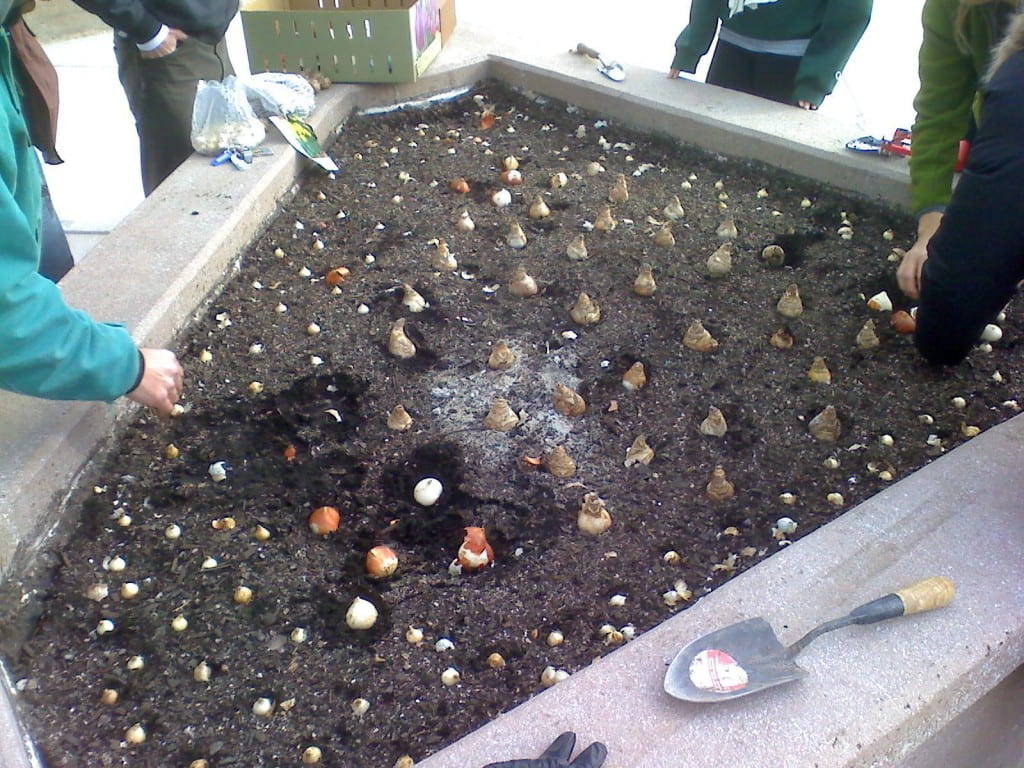
With the completion of construction on the Student Services Roof Plaza, the new planters are ready for planting….except, well, it’s the end of November! Not to be deterred, several student organizations gathered together to provide planting power for flower bulbs purchased by Facilities. On a chilly Thursday, the team from the SGA Environmental Affairs Committee, PEAC and SLO tucked in several hundred tulip and daffodils bulbs for their long winter nap. Come next spring, the triangular area under the small pergola will be the brightest spot on the Plaza.

Additional plants and landscaping will occur in late Spring in all the planters when the soil and air has warmed enough to support their establishment. In addition, SLO will be using several of the planters in the middle of the Plaza for their annual campus organic garden.  Tables and seating will also be added in the Spring helping to make this a new go-to spot for enjoying the nice spring and summer days outside.

Will Wisconsin election results tip scales against renewables?

by Dan Haugen, Midwest Energy News, 11/12/12

Will changing political winds in Wisconsin mean another new direction for wind energy policy in the state?

Wisconsin Republicans reclaimed control of the state’s senate last week, five months after recall elections tipped the balance to Democrats. Republicans will now hold power by a wider margin the 2013 than they held in 2011.

Wind energy advocates are worried that might mean another attempt to repeal the state’s wind farm siting rules, which limit restrcitons that local governments can place on proposed wind developments.

And one Republican state senator has already announced plans to seek a repeal of the state’s renewable electricity standard, though a renewable advocacy group doubts the bill will gain enough support to pass.

Hopes for bipartisanship

Overall, RENEW Wisconsin program and policy director Michael Vicerman expects less hostility and more acceptance of the fact that renewable energy plays a growing role in the state’s economy.

“We are hearing that there are Republican senators that want to introduce positive legislation on renewable energy next year, and they want to do so in a bipartisan fashion,” Vickerman said.

RENEW Wisconsin is a member of RE-AMP, which also publishes Midwest Energy News.

While Republicans haven’t announced their energy agenda, RENEW Wisconsin is concerned about a proposal by Republican state Sen. Frank Lasee that would un-do the state’s wind farm siting policy.

“He’s spearheading a one-person jihad against wind energy,” Vickerman said.

Wisconsin adopted statewide wind siting rules in 2011 that put boundaries on the local zoning and permitting regulations, which had delayed or derailed wind projects in some counties.

In March, Lasee introduced a bill that would have rolled back those rules, putting wind developers back at the mercy of a messy patchwork of local rules, some of which were, in Vickerman’s words, “a never-ending obstacle course” meant to discourage any projects.

Lasee’s effort last spring came up one vote short when Republicans had a 17-16 margin in the state senate. Next year, Lasee’s party is expected to hold an 18-15 majority.

“We survived, really, by the skin of our teeth,” Vickerman said. “All other things being equal, we have to find another Republican senator who will stand [for the wind siting rules.]”

RPS challenge?

The American Legislative Exchange Council, a conservative policy group that promotes identical, model legislation across the country, says it plans to make repealing state renewable mandates a high priority in 2013.

State Sen. Glenn Grothman, a Republican from Sheboygan, has already announced plans for a bill that would freeze Wisconsin’s renewable standard at its 2012 levels.

“The 10 percent renewable portfolio standard imposed on Wisconsin utilities in 2006 was a mistake,” Grothman said in a press release. (The senator’s office didn’t return a phone call last week.)

Vickerman said he is “not particularly worried” about Brothman’s bill. That’s because renewable energy has too many allies – from landfill operators to equipment manufacturers – who understand its importance to growing Wisconsin’s economy.

“He is looking at legislation that would not only scale back commitment to wind energy, but also solar, biogas, landfill gas, hydro – all the resources are covered,” Vickerman said.

For the rest of the article click here.

Campus Multi-Purpose Use Area and Sustainability

As the Sustainability Coordinator for campus, I wanted to respond to student concerns regarding the tree removal and land grading activities currently underway on the three acre tract of land between the Union and Residential Life. First, thanks for caring and being interested in environmental sustainability – apathy and unwillingness to consider changing lifestyle habits are some of the biggest hurdles we face in becoming a more sustainable culture. So, thanks for voicing your concerns!

Next, info on the multi-purpose use area. Yep, it’s a shock to see the clearing of the area, that’s for sure. But there was much discussion on environmental impact of this project and how to do the project with the least long-term impact on sustainability over the two to three years this project was under consideration. I joined the Multi-purpose Use Committee last Spring which already had four other campus Sustainability Committee members participating, including student representatives, so sustainability was always an important consideration on this project.

Some of the items we considered/discussed both on the Sustainability Committee and the Multi-Purpose Use Committee included:

  • Species mix on the area  – was there anything unique or rare to be aware of? Members of the Cofrin Center for Biodiversity walked through the area to evaluate the ‘quality’ of the area and determined it was a typical mix of what you find when you allow a farm field to go ‘natural’, being colonized by the typical plants – both invasives and naturally occurring. Nothing unique that would be displaced. In fact, this area was the dump field for the soil removed in constructing the University Union. The ‘best’ trees (health and species) in the multi-purpose area were marked and saved. We’re really lucky on our campus to have so much already ‘green’ property with 300+ acres of high quality natural ecosystems in the Cofrin Arboretum, plus other native, non-mowed areas in the remaining 300 acres that makes up the rest of campus & housing. Not to lessen the impact of the 3 acres currently being re-purposed, but it certainly was a consideration in whether we could let this area be used in a different way.
  • What about carbon sequestration?  If we cut down trees, we lose their ability to sequester carbon, how do we account for that loss? We looked at other areas on campus where we could do a ‘land swap’, but there are no other intact 3 acre tracts in one chunk that would be suitable, and the ‘bang for the buck’ of carbon sequestration was low on helping lower our overall campus carbon footprint. There are many more actions each one of us can take on campus to lower that footprint – but they involve behavior change, like using Zimride and carpooling with someone once a week (for example). In addition, new plantings will be going into this space – both native trees and plant species – that will help mitigate the loss and actually potentially increase the biodiversity of the area (depending on the number/types of plants going in).
  • Trying to find the balance point: Student/Res Life saw the importance of reusing this area as an outdoor meeting place for students to gather, have events/programs, participate in various sports/outdoor activities, and generally enjoy being outdoors. As a Sustainability Committee, we do want to do what’s best for the environment but we also have a responsibility to make sure you and all future students have an opportunity to actively engage in community building activities outside the classroom or dorm/apartment, and literally in this case, outside! Given the scrubby and ‘non-special’ nature of this 3 acres, the lack of other suitable areas on campus close to academic and residential buildings for repurposing for student outdoor space, the plan to incorporate new native species plantings including tress, and the other 300+ acres of high quality natural habitat on campus, we agreed to support this project.

 Also, I encourage you to get involved in student organizations like PEAC or SLO or the SGA Environmental Affairs committee – all these orgs are actively involved in environmental and sustainability efforts on campus and certainly welcome new members.

Don’t Forget: Take the Commuting Survey by Nov. 2nd

You’ve got a few more days to provide your input! How we commute to campus appears to be a significant ‘chunk’ of our overall campuswide greenhouse gas emissions, contributing approximately 27% of our total emissions.  For comparison purposes, our greenhouse gas emissions resulting from burning natural gas to heat the entire campus for a year’s period is 19% of our total emissions (FY2012 data). However, our commuting emissions are based on older data and that’s where we need your help!

Please take this short survey to update our data set. In addition, please provide feedback on Zimride, the ridesharing/commuting website that helps you find a ride to share with someone else – commuting or one-way trips (zimride.uwgb.edu).  We are halfway through our contract with Zimride and want to get a sense of participation and usage of the program which targets reducing solo trips in a vehicle, thus reducing emissions.

 Tracking and measuring the impact of “Eco-U” through an annual greenhouse gas inventory helps us better understand our progress and is a requirement of our participation in the American College and University President’s Climate Commitment.

 Thank you for taking the time to help us better understand where we’re at in working to make Eco-U greener.

 UWGB Sustainability Committee